

Two dimensions of vulnerability
Understanding who is disproportionately affected requires examining both:
- Biological vulnerability: Who is more susceptible to harm from pollution
-
- Physiology.
- Age.
- Pre-existing disease.
- Exposure disparity: Who faces greater exposure due to social and environmental factors
-
- Where you live and work.
- Socioeconomic status.
Environmental injustice occurs when these dimensions intersect—where vulnerable populations bear a disproportionate burden of environmental harm (exposure disparity).
Biological vulnerability
Key vulnerable groups face heightened phsiological susceptibility to air pollution’s harmful effects.
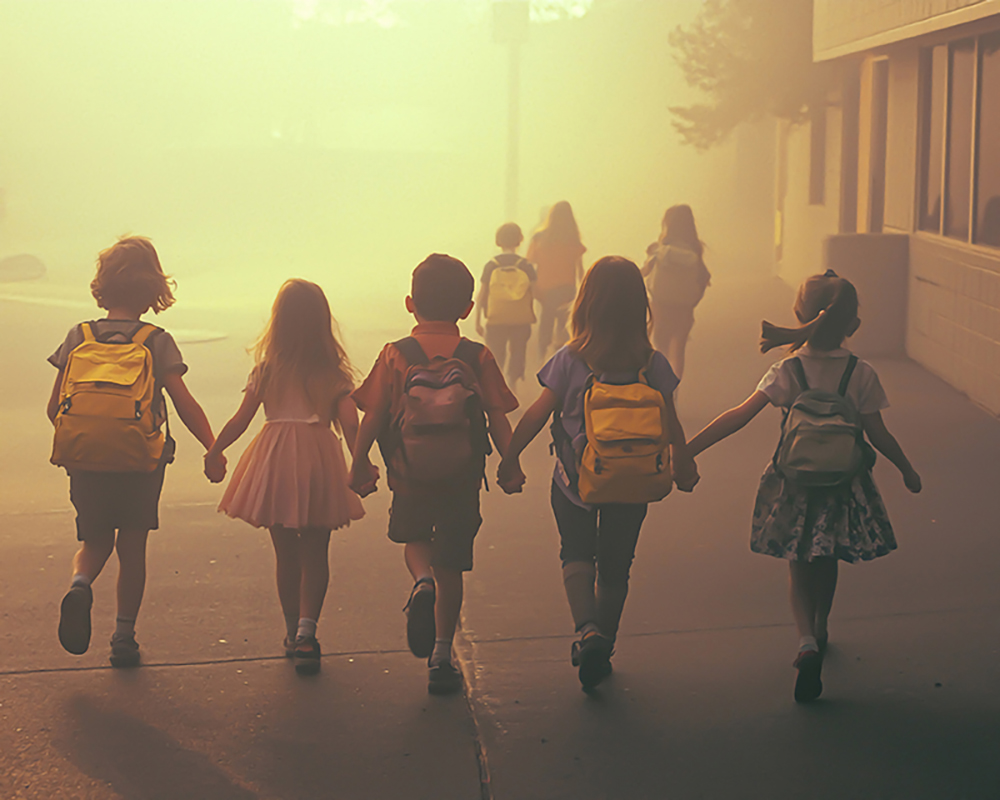
Children: Heightened susceptibility
Physiological factors making children more vulnerable
- Airways continue developing through adolescence.
- Alveolarization continues until age 8–10.
- Smaller airway diameter → Greater impact from inflammation/obstruction.
- Less developed detoxification mechanisms.
- Pollution during development → Permanent structural changes.
- Children breathe more rapidly than adults.
- Substantially higher ventilation rate per kilogram body weight.
- Result: A higher dose of pollution per unit body mass.
- Example: A 6-year-old inhales 50% more air per kg than an adult.
- More hours outdoors than adults.
- Physical activity during recess, sports.
- Higher ventilation rate during exercise → Even greater dose.
- Often outdoors during peak pollution hours (afternoon ozone).
- Earlier exposure = More cumulative lifetime burden.
- More years for chronic disease to develop.
- Early-life exposure may “program” disease risk.
- Critical windows of brain development.
- Immune system maturation affected by pollution.
- May increase allergy and asthma risk.
- Neurodevelopmental impacts (cognitive, behavioral).
- Key findings
- Clinical implications
- Children living near major roadways (within 500m) showed 5–7% decrease in FEV1 by age 18.
- Deficits persisted into adulthood.
- Effects were independent of smoking exposure.
- Demonstrates permanent impact on lung-function growth. trajectories
- Greater risk of asthma development.
- More severe asthma exacerbations.
- Impaired lung function persisting into adulthood.
- Neurodevelopmental impacts affecting lifelong outcomes.
- Early intervention is critical: Protecting children now protects the adults they’ll become.
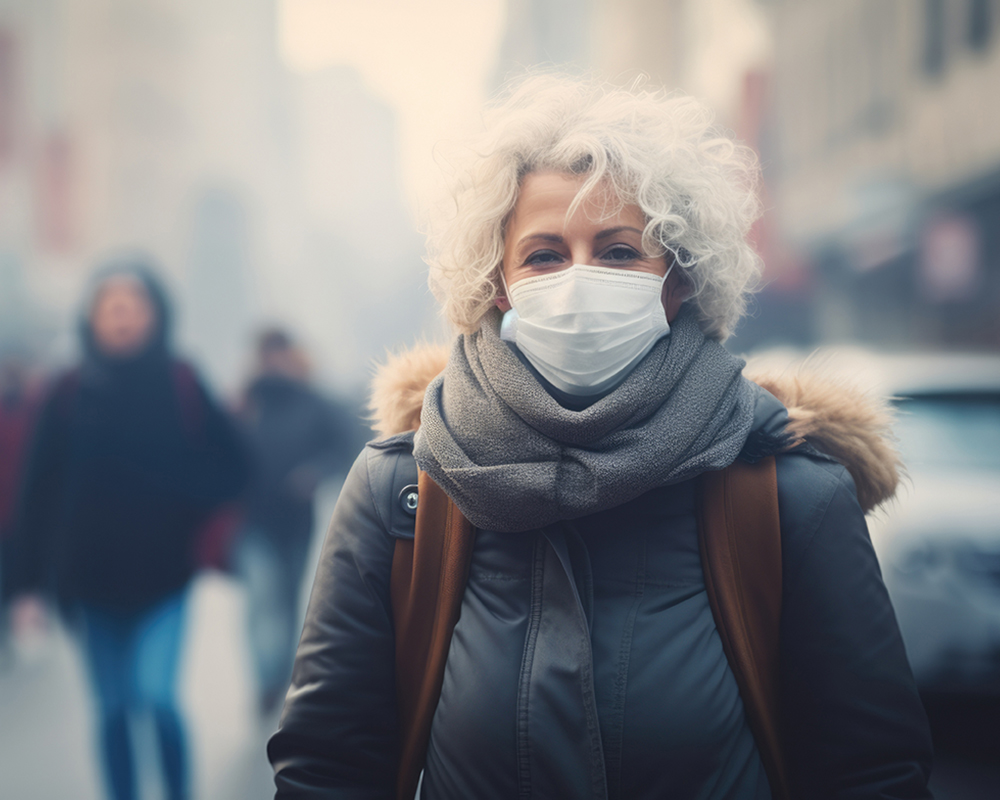
Elderly: Reduced physiologic reserve
Physiologic factors increasing vulnerability
- Reduced ability to clear pathogens and particles.
- Impaired inflammatory response regulation.
- Less effective repair of pollution-induced damage.
- Existing cardiovascular disease → Greater MI/stroke risk from pollution.
- COPD or heart failure → Less reserve to handle acute insults.
- Diabetes → Impaired endothelial function compounds pollution effects.
- Multiple conditions interact synergistically.
- Less capacity to compensate for acute stressors.
- Cardiovascular system cannot increase cardiac output as effectively.
- Respiratory system has less FEV1 reserve.
- Small perturbations → Clinical decompensation.
- Multiple medications common in elderly.
- Potential interactions with inflammatory stress from pollution.
- Medications for chronic conditions may be less effective during high pollution.
- Evidence
- Clinical implications
“Air Pollution and Mortality in the Medicare Population.”
- Largest United States study: 60+ million Medicare beneficiaries.
- Each 10 μg/m³ PM2.5 → 7.3% increase in mortality.
- Elderly show 2–5x elevated mortality risk during high-pollution episodes compared to younger adults.
- Effects seen even at PM2.5 levels below current standards.
Di et al. (2017) – NEJM
- Higher mortality during air pollution episodes.
- Increased hospitalization rates for cardiopulmonary events.
- Greater susceptibility to respiratory infections during poor air quality.
- Need for proactive protection (AQI monitoring, behavior modification).
- Pre-existing chronic lung disease includes:
- Asthma.
- Chronic obstructive pulmonary disease (COPD).
- Interstitial lung disease (ILD).
- Why they’re vulnerable:
- Baseline airway inflammation: Pre-existing inflammatory state amplifies response to pollution.
- Reduced respiratory reserve: Less FEV1 to “lose” before symptoms appear.
- Altered-defense mechanisms: Impaired mucociliary clearance, damaged epithelium.
- Medication dependence: May require rescue medication escalation.
- Clinical implications:
- Disproportionately high emergency department visits during pollution episodes.
- More severe exacerbations requiring hospitalization.
- Accelerated disease progression with chronic exposure.
- Cannot avoid exposure impact even with medication adherence.
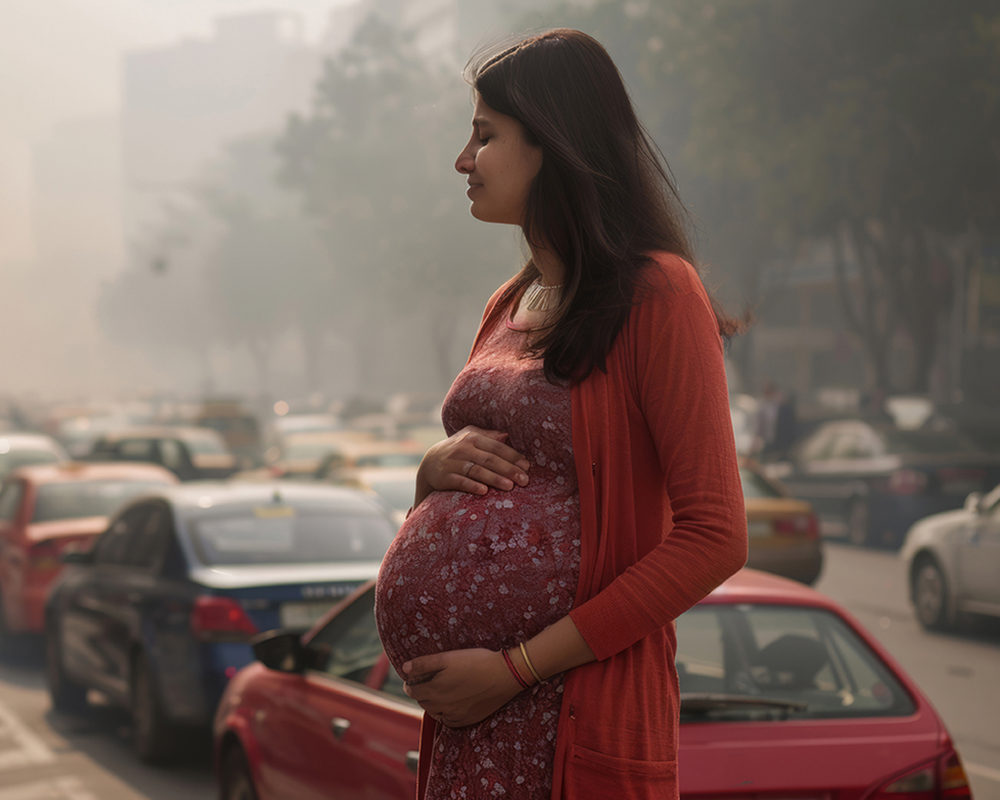
Pregnancy: Maternal and fetal vulnerability
Pregnant individuals are uniquely vulnerable because pregnancy creates a window of heightened susceptibility for both the pregnant person and the developing fetus. Air pollution exposure during pregnancy can have immediate and long-lasting consequences.
Maternal physiological changes increasing vulnerability
Pregnant individuals breathe 30–50% more air volume per day, increasing pollutant dose.
Pregnancy-related immunomodulation affects inflammatory responses to pollution.
Higher oxygen consumption means greater exposure to airborne pollutants.
Increased blood volume and cardiac output may amplify systemic pollution effects.
Mechanisms of maternal-fetal harm
Synthesized from Johnson et al. (2021), Environ Health Prev Med, 26(1):72.
- Placental oxidative stress: PM2.5 triggers reactive oxygen species (ROS) production in placental tissue, directly impairing function.
- Placental inflammation: Systemic and local inflammatory cytokines compromise nutrient and oxygen transfer to fetus.
- Reduced placental perfusion: Vascular effects limit blood flow to fetus.
- Endocrine disruption: Air pollutants act as endocrine disruptors influencing fetal development and long-term cardio-metabolic health.
- Ultrafine particle (PM0.1) translocation: Ultrafine particles can directly cross the placental barrier, reaching the fetus directly. Unlike PM2.5, PM0.1 is not currently regulated or routinely measured, representing a critical gap in current air quality standards.**
- Epigenetic changes: Both PM2.5 and PM0.1 alter fetal gene expression patterns with potential lifelong consequences.
**Critical knowledge gap: Unregulated Ultrafine particles
Current air quality standards regulate PM2.5 and PM10, but PM0.1 (ultrafine particles) are neither regulated nor routinely measured, despite evidence they:
- Penetrate deeper into lung tissue than larger particles.
- Can directly translocate across the placental barrier.
- Are generated in high concentrations near traffic and industrial sources.
- Disproportionately affect low-income and minority communities near these sources.
Johnson et al. (2021). Environ Health Prev Med, 26(1):72. PMID: 34253165.
Evidence-based associations
- Low birth weight: Each 10 μg/m³ increase in PM2.5 → 10-20g decrease in birth weight.
- Effect size comparable to maternal smoking.
- Dose-response relationship demonstrated.
- Preterm birth: Increased risk with chronic exposure and acute pollution episodes.
- Third trimester exposure particularly critical.
- Casey et al. (2018): 20% reduction in preterm birth near closed coal plants.
- Stillbirth: Associations with high PM2.5 exposure, particularly in late pregnancy.
- Gestational hypertension/preeclampsia: PM2.5 exposure linked to increased risk.
- Gestational diabetes: Emerging evidence of metabolic effects.
- Neurodevelopmental effects:
- In utero exposure associated with cognitive deficits in childhood.
- Increased risk of autism spectrum disorder (emerging evidence).
- Attention and behavioral problems.
- Respiratory consequences:
- Higher childhood asthma rates with prenatal exposure.
- Reduced lung function persisting into childhood.
- Immune system programming: Altered immune development may affect lifelong health.
- First trimester: Organogenesis (critical for organ development, particularly brain and heart).
- Second trimester: Rapid fetal growth, lung development.
- Third trimester: Brain development continues, preterm birth-risk peaks.
- All trimesters matter: Different outcomes associated with exposure timing.
- Risk assessment: Include residential proximity to pollution sources in the prenatal history.
- AQI monitoring: Recommend daily checking, especially during wildfire season.
- Protective behaviors:
- Limit outdoor activity when AQI >100 (orange or worse).
- Keep windows closed during poor air quality days.
- Use HEPA air filtration if available/affordable
- Avoid exercise outdoors during high pollution.
- Frame as modifiable risk factor: Unlike many pregnancy risks, air quality exposure can be reduced through behavior change.
- Consider referrals: Social work for patients unable to avoid high-exposure environments (housing near highways, occupational exposure).
- Neighborhood context matters: Preventive strategies must address both neighborhood/regional planning AND individual clinical recommendations. Individual counseling alone is insufficient without policy change.
Pregnant individuals in low-income communities and communities of color face compounded risk:
- Higher baseline pollution exposure (proximity to highways, industry).
- Less access to protective resources (air conditioning, HEPA filters).
- Occupational exposures (cannot avoid outdoor work).
- Limited prenatal care access to receive counseling.
- Housing instability preventing relocation from high-pollution areas.
Air pollution contributes to birth outcome disparities and perpetuates health inequity across generations.
Social determinants and environmental justice
There are geographic disparities in pollution exposure. Not everyone breathes the same air. Pollution exposure is unequally distributed based on race, income, and historical policy decisions.
Proximity to pollution sources
- Major highways: Pollution gradients extending 300–500 meters.
- PM2.5, NOx, and ultra-fine particles are elevated near roadways.
- Who lives there? Disproportionately low-income and communities of color.
- Industrial facilities: Refineries, power plants, chemical manufacturing.
- Multiple pollutants (VOCs, SO₂, NOx, toxics).
- Often located in or adjacent to low-income communities.
- Ports and distribution centers: Diesel truck and ship emissions.
- Concentrated in urban areas near freight corridors.
- Heavy diesel particulate exposure.
- Waste facilities: Incinerators, landfills.
- Emissions of particulates and toxics.
- Zoning historically allowed in low-income areas.
Low-income communities
Economic factors creating exposure disparities
- Lower housing costs near pollution sources create economic pressure to live there.
- “Environmental amenity” discount: Homes near highways and industry are valued lower.
- Limited housing choices for low-income families.
- Cannot afford to relocate even when aware of health risks.
- Cannot afford home modifications (air conditioning, HEPA filtration).
- May lack transportation to avoid high-pollution areas.
- Less able to stay home from work during poor air quality.
- Limited access to healthcare to manage pollution-related illness.
Low-income communities often face multiple concurrent stressors including:
- Air pollution (topic of this module).
- Noise pollution (traffic, industrial).
- Lack of green space and tree canopy.
- Food insecurity.
- Inadequate housing quality.
- Limited healthcare access.
- Occupational hazards.
Result: Compounding health effects that amplify pollution impact.
Communities of color
PM2.5 polluters disproportionately and systemically affect people of color in the United States.
Tessum et al. (2021). Science Advances.
- Key findings
- Interpretation
- Black Americans are exposed to 56% more PM2.5 than they produce through consumption.
- Hispanic/Latino Americans: 63% more exposure than production.
- White Americans: 17% less exposure than production.
- Disparity persists across all income levels, not solely explained by poverty.
- Pattern: Communities of color bear pollution burden from consumption of entire population.
On average, White Americans experience less PM2.5 pollution than is caused by their consumption, while Black and Hispanic Americans experience substantially more pollution than is caused by their consumption. This represents a systemic environmental inequity.
Historical context: How did this happen?
- Redlining (1930s–1960s):
- Highway construction (1950s–1970s):
- Industrial zoning practices
- Federal Housing Administration systematically denied mortgages in minority neighborhoods.
- Marked areas as “hazardous” for lending (coded red on maps, hence “redlining”).
- Concentrated communities of color in specific areas.
- Simultaneously, industrial facilities and highways were sited in or near these “redlined” areas.
- Result: Institutionalized residential segregation that persists today.
- Interstate highway system construction deliberately routed through minority neighborhoods.
- Displaced communities and divided neighborhoods.
- Created pollution exposure corridors through communities of color.
- Example: >10% of Black neighborhoods had highways constructed through them.
- Polluting facilities preferentially permitted in low-income areas and communities of color.
- Less political power to resist facility siting.
- “Path of least resistance” for industry.
- Created concentration of multiple pollution sources (“cumulative impacts”).
Associations between historical residential redlining and current age-adjusted rates of emergency department visits due to asthma. Eight California cities were examined. Areas redlined 80+ years ago still have higher asthma ED visit rates today. This demonstrates lasting health impacts of historical discriminatory policies.
Nardone et al. (2020). Lancet Planetary Health.
Current geographic patterns
- Black and Hispanic communities disproportionately near:
- Highways and major roadways.
- Industrial facilities and refineries.
- Ports and freight corridors.
- Waste facilities.
- Income-adjusted disparities persist—This is not solely about poverty.
- Pattern exists in virtually every major U.S. city.
Intersecton with healthcare access
- Environmental justice communities often have limited healthcare access.
- Uninsured/underinsured populations less able to manage chronic conditions.
- Language and cultural barriers to receiving air quality warnings.
- Less ability to modify behavior (no air conditioning, cannot miss work).
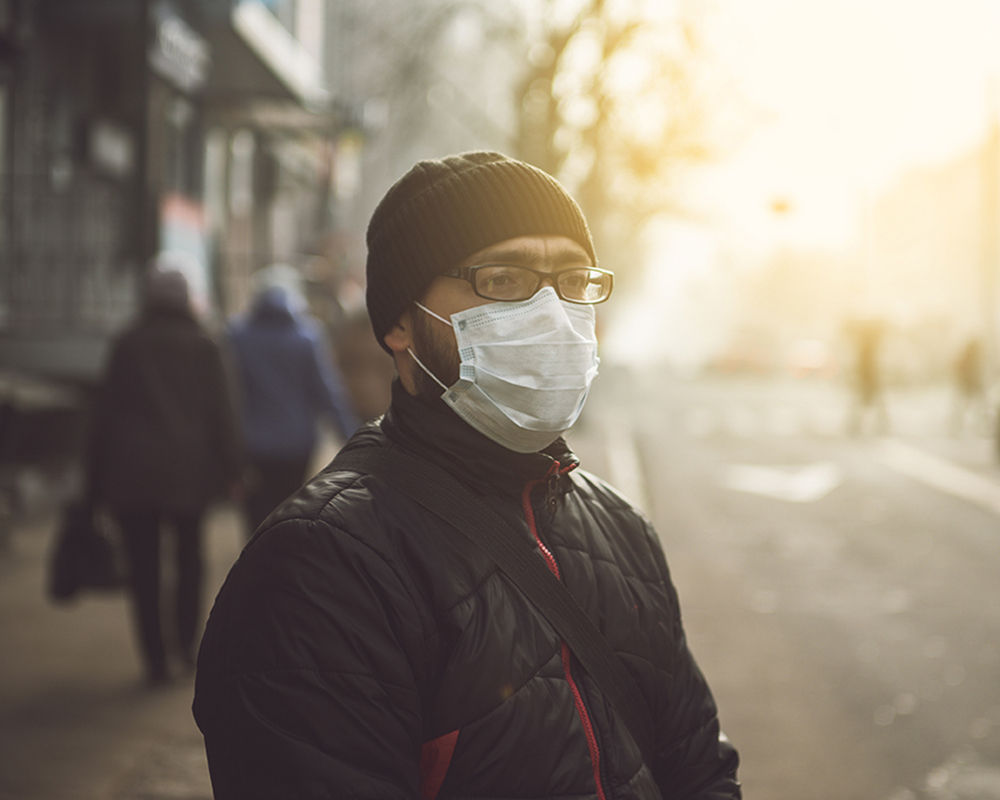
Occupational exposures
It is often low-income workers and workers of color who work outdoors or in high-pollution jobs.
- Outdoor workers:
- Construction.
- Landscaping.
- Agriculture.
- Transportation:
- Delivery drivers.
- Traffic police.
- Bus and truck drivers.
- Industrial workers:
- Manufacturing.
- Refineries (poorly ventilated settings).
- Service workers:
- Street vendors.
- Parking attendants.
- Workers in these occupations often also live in high-pollution areas
- Exposed at work and at home.
- Cannot avoid exposure for economic reasons (need to work).
- Less able to take protective measures (no paid sick days, cannot afford N95 masks).
- Agricultural dust and pesticide exposure.
- Often live in agricultural areas (continued exposure at home).
- Predominantly Hispanic/Latino.
- Limited healthcare access.
- Cannot avoid work during poor air quality.
- Limited protective measures, including sick days and access to masks.
- Compounded with heat exposure.
Question 2: Environmental justice and vulnerability
Which of the following populations experience disproportionate air pollution exposure primarily due to social determinants of health, rather than biological factors?
The low-income family living 100 meters from a major highway experiences disproportionate exposure primarily due to social determinants: Economic constraints limiting housing choices, historical patterns of highway placement through low-income neighborhoods, and zoning practices. This is environmental injustice driven by structural factors, not biological vulnerability.
PM2.5 and NOx levels can be 35–40% higher within 300m of highways. Low-income families often have no choice but to live in these high-exposure zones due to lower housing costs and limited alternatives.
Why other options are incorrect:
All of these answers represent biological vulnerability (age, pre-existing disease, pregnancy) rather than social determinants of exposure.
The question specifically asks about disproportionate exposure due to social determinants, not biological susceptibility.
Activity 2: Environmental justice investigation
Instructions: Choose one approach.
- California: CalEnviroScreen (widely considered the gold standard).
- Washington State: Dept of Ecology State of Washington and WA Environmental Health Disparities Map.
- New Jersey: NJDEP Environmental Justice.
- CDC Environmental Health Tracking: Air Quality Tracker.
- Research a local case: Search “Spokane highway pollution disparities” or “Spokane industrial facilities demographics.”
- Use Google Maps to identify: Highways, Industrial facilities, and power plants in your community.
- Use Census data (data.census.gov) to examine demographics of nearby zip codes.
- Compare pollution sources in affluent vs. low-income neighborhoods.
Think about this
- What patterns do you notice between pollution exposure and demographics?
- Which populations face the highest cumulative burden?
- How might this affect patient presentations in clinical practice?
Environmental justice analysis remains critical regardless of federal policy changes. Many states, academic institutions, and community organizations maintain robust environmental health tracking systems.
previous
Health Consequences
Next
Multi-level Interventions and Co-Benefits