

Transportation sector
The transportation sector is the largest contributor to urban air pollution in most developed countries, mainly due to vehicle emissions.
- Nitrogen oxides (NOx): Formed during high-temperature combustion, NOx contributes to ozone formation and respiratory irritation.
- Volatile organic compounds (VOCs): React with NOx in sunlight to form ozone; some VOCs are carcinogenic.
- Particulate matter (PM): Both PM2.5 and PM10 from exhaust, tire wear, and brake dust.
- Carbon monoxide (CO): Incomplete combustion product that reduces oxygen delivery to tissues.
- Transportation: 29% of total greenhouse gas emissions.
- On-road vehicles: 55% of transportation-related NOx.
- Diesel trucks: Disproportionately high PM and NOx despite smaller fleet.
- Creates pollution gradients extending 300–500 meters from major roadways.
- Exposure declines by 50% at 100–150 meters from highway
- Affects millions living near highways and major roads.
Industrial and energy production
Electricity generation from fossil fuels remains a major source of air pollution despite improvements in emission controls.
- Sulfur dioxide (SO₂): Acid gas causing respiratory irritation and contributing to acid rain.
- Nitrogen oxides (NOx): Contributes to ozone and particulate formation.
- Particulate matter: Directly emitted and formed secondarily in atmosphere.
- Mercury: Neurotoxin bioaccumulating in food chain.
- Carbon dioxide (CO₂): Primary greenhouse gas driving climate change.
- Industrial facilities are often located near ports and railroads.
- Industry is historically sited in or near low-income communities.
- There is cumulative exposure from multiple facilities in industrial zones.
Emission profile comparison
(per unit energy)
- SO₂: High (unless scrubbers installed).
- NOx: High.
- PM: High.
- CO₂: Highest among fossil fuels.
- Mercury: Significant.
- SO₂: Minimal.
- NOx: Moderate.
- PM: Low.
- CO₂: ~50% lower than coal per unit energy.
- Mercury: Minimal.
- Operational emissions: Near-zero for all pollutants.
- Lifecycle emissions: Minimal (manufacturing only).
- VOCs.
- SO₂.
- NOx
- Benzene (carcinogenic).
- PM.
- SO₂.
- NOx.
- CO₂.
- PM.
- SO₂.
- Heavy metals.
- Ammonia (NH₃) emissions:
- Primary source: Livestock operations (manure management).
- Contributes to secondary particulate matter formation.
- Affects air quality downwind of concentrated animal feeding operations.
- Pesticide and fertilizer application:
- VOCs from pesticide drift.
- Nitrogen compounds contributing to reactive nitrogen in atmosphere.
- Disproportionately affects farmworkers and rural communities.
- Dust from agricultural activities:
- Tilling operations generate PM10 and PM2.5.
- Harvest operations, particularly in dry conditions.
- Unpaved roads in agricultural areas.
- Health impacts on agricultural workers:
- Higher respiratory disease rates.
- Pesticide exposure adding to pollution burden.
Climate change mechanisms degrading air quality
Climate change acts as a threat multiplier for air quality. It doesn't just add pollution; it amplifies existing sources and creates new pathways for degradation.
Key mechanism 1: Wildfire smoke
Rising global temperatures and prolonged droughts create conditions that dramatically increase wildfire risk and intensity.
The wildfire-climate feedback loop
- Higher temperatures dry out vegetation (fuel).
- Earlier snowmelt extends dry season.
- Prolonged droughts create tinderbox conditions.
- More frequent heat waves and low humidity periods.
- Increase in number of fires in western United States.
- Longer fire season.
- Megafires (>100,000 acres) becoming more common.
- Smoke can travel 200–500+ miles from the fire source.
- Affects people far from fire zones.
- Creates multi-day to multi-week air quality events.
- Wildfire smoke composition
- Clinical relevance
- Recent examples
- PM2.5: 80–90% of smoke mass, primary health concern.
- Carbon monoxide (CO): Incomplete combustion product.
- VOCs: Including benzene and formaldehyde (carcinogens).
- Polycyclic aromatic hydrocarbons (PAHs): Toxic and carcinogenic.
- Ozone precursors: NOx and VOCs that form ozone downwind.
There is evolving evidence that wildfire PM2.5 may be more toxic than other PM2.5 sources due to organic carbon content and smaller particle size (Aguilera et al., 2021).
- 2023 Canadian wildfires: Smoke reached NYC (600+ miles), AQI >400.
What you’re seeing:
- Gray/brown plumes = PM2.5-rich wildfire smoke.
- Movement over 2–3 days from Canada to U.S. East Coast.
- During this event, NYC AQI exceeded 400 (hazardous)—worst in the world at that time.
- Millions advised to stay indoors, hospitals saw surge in respiratory complaints.
future projections
If warming continues unabated, fire season could increase by 50+ additional days by 2050, with corresponding increases in smoke exposure days for tens of millions of people.
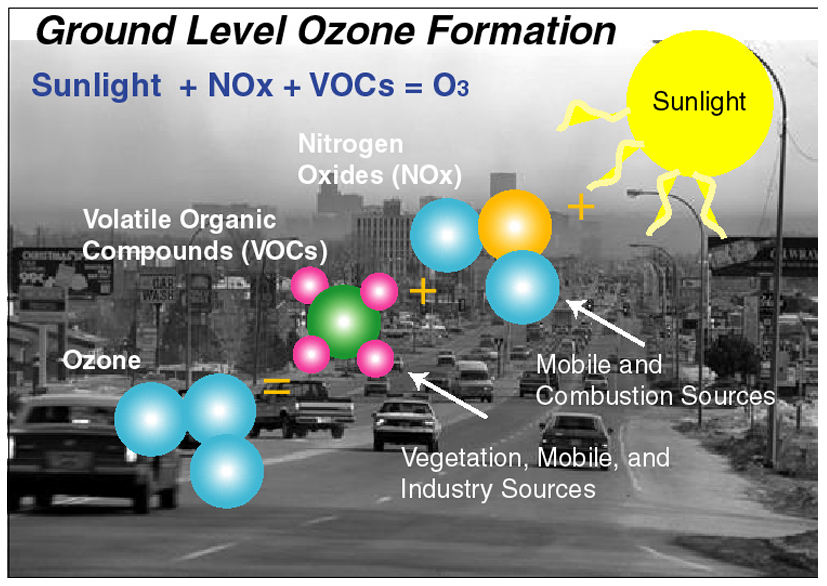
Key mechanism 2: Ground-level ozone formation
Ground-level ozone (O₃) is not directly emitted. It forms through photochemical reactions that are highly temperature-dependent.
- Temperature dependence
- Why temperature matters
- Evidence of climate impact
- Timing and geography
- Clinical relevance
- Each 10°F increase = 10–20% more ozone production.
- Heat waves correlate strongly with ozone exceedance days.
Ozone forms from precursor emissions in sunlight and is more likely to reach unhealthy levels on hot, sunny days. Warming can worsen ozone pollution in some regions.
- Ozone concentrations have declined less than other pollutants despite emission controls.
- Summer ozone episodes becoming more frequent and severe.
- Ozone season lengthening—starting earlier, ending later.
- Cities that met ozone standards now exceeding them during heat waves.
- When ozone is worst:
- Season: Summer (May–September in Northern Hemisphere).
- Time of day: Afternoon (2–6 PM) when sunlight and heat peak.
- Weather: Clear, hot, stagnant days.
- Where ozone is worst:
- Downwind of urban areas (NOx + VOC sources).
- Areas with high vehicle emissions.
- Cities in basins or valleys (air trapping).
EPA issues Code Orange (unhealthy for sensitive groups) and Code Red (unhealthy for all) air-quality alerts when ozone reaches unhealthy levels.
Action: Advise vulnerable patients to check AirNow.gov daily and limit outdoor activity on high-ozone days, especially during afternoon hours.
future projections
Climate models predict that without emission reductions, warming alone could increase ozone concentrations by 5–15 ppb in many regions by 2050, offsetting gains from emission controls.
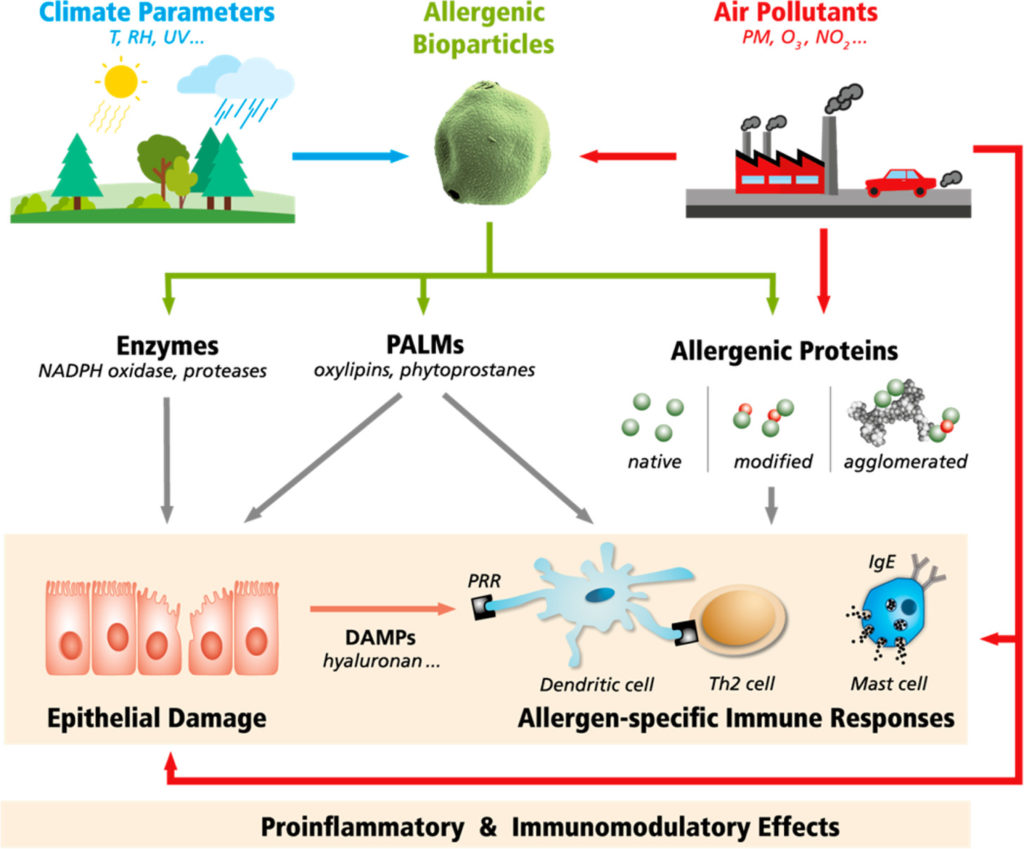
Key mechanism 3: Extended and intensified pollen season
Warming temperatures and elevated atmospheric CO₂ directly affect plant biology, leading to longer, more intense pollen seasons.
Mechanisms of change
- Earlier spring onset → Earlier pollen season start.
- Later first frost → Extended fall ragweed season.
- Net result: 10–30 additional pollen days across North America.
- Some regions: Pollen season now 30+ days longer than in 1990.
- Elevated atmospheric CO₂ acts as plant fertilizer.
- Laboratory studies: Up to 61% increase in pollen production per plant with doubled CO₂.
- Ragweed particularly responsive to CO₂ enrichment.
- Changes in pollen protein composition under elevated CO₂.
- Some allergen proteins increase in concentration.
- Result: More allergenic pollen, not just more pollen.
- Evidence based
- Health implications
- Clinical relevance
W.R.L. Anderegg, J.T. Abatzoglou, L.D.L. Anderegg, L. Bielory, P.L. Kinney, & L. Ziska, Anthropogenic climate change is worsening North American pollen seasons. Proc. Natl. Acad. Sci. U.S.A. 118 (7) e2013284118(2021).
- 60+ years of pollen monitoring data analyzed.
- 20% increase in pollen concentrations since 1990.
- Pollen season starts 20 days earlier on average.
- Clear attribution to rising temperatures and CO₂.
- More people exposed to pollen allergens.
- Longer exposure duration for those affected.
- Higher ambient pollen concentrations.
- Increased allergic rhinitis and asthma exacerbations.
- New geographic areas becoming suitable for allergenic plants.
Patients with allergic rhinitis and asthma may require longer durations of prophylactic medication. Consider earlier seasonal treatment initiation.
future projections
By 2040–2060, pollen seasons could be 40–60% longer than late 20th century baseline in many regions, with continued increases in pollen concentrations.
Synergistic effects: How climate amplifies air pollution
Climate change doesn't just create individual problems—multiple mechanisms compound to create worse air quality episodes.
- Mechanism: High-pressure systems trap warm air at the surface and prevent dispersion of pollutants.
- Effect on air quality: Emissions concentrate near ground level, (where people breathe), and create multi-day pollution episodes.
- Climate connection: Heat domes becoming more frequent and longer-lasting.
Cities run 5–10°F warmer than surrounding areas because:
- Dark surfaces (asphalt, rooftops) trap heat.
- Vegetation is sparse—meaning little cooling from evapotranspiration (the natural air-conditioning effect of plants releasing water vapor).
- Buildings and vehicles shed waste heat continuously.
This matters for air quality because ozone formation is temperature dependent. Hotter urban air means higher ozone peaks and levels that stay elevated later into the evening. As background temperatures rise globally, the effect intensifies.
Clinical takeaway: Your highest-risk patients—asthma, COPD, cardiovascular disease, and the elderly—are disproportionately likely to live in the areas hit hardest by both heat and poor air quality simultaneously.
Multiple pollution sources and mechanisms can occur simultaneously.
Example Compound Event (Western United States, Summer):
- Heat wave increases temperature to 95–105°F.
- Drought conditions → Wildfire ignitions → Smoke transport
- High temperatures + traffic emissions → Ozone formation.
- Heat dome traps both smoke PM2.5 and ozone near surface.
- Urban heat island adds 5–10°F, amplifying ozone further.
Result: Multiple pollutants at unhealthy levels simultaneously, affecting people over a large geographic area for days to weeks.
- Wildfire-climate loop: More fires → More CO₂ → More warming → Even more fires.
- Vegetation-heat loop: Heat/drought stress vegetation → Less CO₂ uptake → More warming.
- Black carbon on snow: Fire soot darkens snow → Faster melting[GA1] → Drier conditions → More fire risk.
The faster snow melt causes drier conditions is because when the snow melts faster, it is gone sooner, leading to an earlier start to the dry season with less water coming in gradually over time. There is a prolonged dry season.
These synergistic effects mean that:
- Air quality episodes are becoming more severe.
- More pollutants elevated simultaneously (not just one).
- Longer duration events (days to weeks instead of hours to days).
- Health impacts may be greater than sum of individual pollutants.
Activity 1: Air quality investigation
Time: 5 minutes
Instructions:
- Visit AirNow.gov.
- Check current air quality for your location or a selected city.
- Identify the primary pollutant(s) listed (PM2.5, ozone, PM10, etc.).
- Review the forecast for the next 3 days. Do you see patterns?
- Click on a nearby monitoring station to see hourly trends.
Think about this
- How do current temperatures compare to historical averages for this date?
- If ozone is the primary pollutant, what time of day is it highest? Why?
- If PM2.5 is elevated, can you identify potential sources (wildfires, traffic, industrial)?

Bookmark AirNow.gov and make it a habit to check air quality just like you’d check the weather. As a future physician, you should be aware of environmental conditions affecting your patients.
previous
Introduction to Degraded Air Quality
Next
Health Consequences