


- Learning Goals
- Demonstrate respectful, constructive, adaptive interactions with peers and/or facilitators, including punctual attendance, advanced preparation, professionalism, and giving and receiving feedback
- Interpret and calculate statistical tests that are used in the health sciences
In the large-group session, you learned about a few basic statistical methods used in the health sciences. In this small group session, you will calculate some statistical tests to better understand how to interpret them when reading the literature.
Odds ratio
The odds ratio is the measure of association for a case-control study. It quantifies the relationship between exposure (such as eating food or attending an event) and a disease in a case-control study. The odds ratio is calculated using the number of case patients who did or did not have exposure to a factor (such as a particular food) and the number of controls who did or did not have the exposure. The odds ratio tells us how much higher the odds of exposure are among case patients than among controls.
Risk ratio
A risk ratio (RR), also called relative risk, compares the risk of a health event (disease, injury, risk factor, or death) among one group with the risk among another group. It does so by dividing the risk (incidence proportion, attack rate) in group 1 by the risk (incidence proportion, attack rate) in group 2. The two groups are typically differentiated by such demographic factors as sex (e.g., males versus females) or by exposure to a suspected risk factor (e.g., did or did not eat potato salad). Often, the group of primary interest is labeled the exposed group, and the comparison group is labeled the unexposed group.
Risk Ratios are typically used in cohort studies.
It is best to solve the following problems as a group.
- Go to the board to figure this out.
- Do not use any online calculators.
- Show your work!
- Discuss what the numbers mean.
Problem 1
A case-control study assesses the relationship between sleep satisfaction and breast cancer. A total of 2852 subjects are enrolled in the study. Half of the study participants have breast cancer, and half are matched controls. The investigators report that 276 of the patients with breast cancer and 215 of the controls were dissatisfied with their sleep satisfaction.
Based on these results, what is the best estimate of the odds ratio for breast cancer among those who were satisfied with their sleep versus those who were dissatisfied with their sleep satisfaction?
| Component | Breast cancer | No breast cancer |
|---|---|---|
|
Dissatisfied with sleep satisfaction |
276 (a)
|
215 (b)
|
|
Satisfied with sleep satisfaction |
1150(c) |
1211 (d) |
|
Total |
1426 |
1426 |
Note: The magnitude of the odds ratio is called the “strength of the association.” The further away an odds ratio is from 1.0, the more likely it is that the relationship between the exposure and the disease is causal. For example, an odds ratio of 1.2 is above 1.0 but is not a strong association. An odds ratio of 10 suggests a stronger association. Is this a strong association? I would argue not.
OR = (a/b)/(c/d) or (a*d)/(b*c)
276/215 = 1.28
1150/1211 = 0.95
OR = 1.28/0.95 = 1.35
OR=1.35
276*1211 = 334,236
215*1150 = 247,250
334,236/247,250 = 1.35
Problem 2
A cohort study in smokers assesses the role of the SNP rs1051730 and the risk of developing lung cancer. One hundred thirty smokers are followed for ten years to assess the development of myocardial infarction. Ten develop lung cancer in the group of 60 patients with “normal” SNP rs1051730. In the group of 70 patients with an SNP rs1051730 variant, 25 develop lung cancer.
Which of the following is the best estimate of relative risk in patients with a variant in the SNP rs1051730 compared to patients with a normal genotype of SNP rs1051730?
| Component | Lung cancer | No lung cancer | Total |
|---|---|---|---|
|
Variant SNP rs1051730 |
25
|
45
|
70
|
|
Normal SNP rs1051730 |
10 |
50 |
60 |
The relative risk (RR) or risk ratio is the ratio of the probability of an outcome in an exposed group to the probability of an outcome in an unexposed group.
RR = (25/70)/(10/60) = 2.143
Expressed in plain English, the Variant SNP rs1051730, relative to the normal SNP rs1051730, is associated with a 2.1-fold increased risk of lung cancer in smokers. This can also be stated in several other ways:
- Variant SNP rs1051730 is associated with a more than doubled risk of lung cancer.
The risk of lung cancer with the variant SNP rs1051730 is 2.1 times that with the normal SNP rs1051730. - The risk of lung cancer with Variant SNP rs1051730 is 210% that with the normal SNP rs1051730
- The variant SNP rs1051730 is associated with a 1.1-fold increase in the risk of lung cancer.
- The variant SNP rs1051730 is associated with a 140% increase in the risk of lung cancer. (An explanatory note here: Why 1.4 and 140%? Because an RR of 2.1 means “2.1/1,” or 2.1 cases with the variant SNP rs1051730 for every case with the normal SNP. In other words, there are 1.1 extra cases with the variant SNP rs1051730 for every case with the normal SNP; 1.1 and 110% are synonymous.)
Problem 3
When reading a recent case-control investigation, you viewed the following statement: "Daily cannabis use was associated with increased odds of psychotic disorder compared with never users (adjusted odds ratio [OR] 3.2, 95% CI 2.2–4.1), increasing to nearly five-times increased odds for daily use of high-potency types of cannabis (4.8, 2.5–6.3).
Using the term “percentage,” what is another possible way of interpreting this finding regarding the use of high-potency cannabis?
A further explanation
To interpret this finding in terms of percentages, you can use the following transformation: Percentage Increase=(OR−1)×100
In this case
- Percentage Increase=(4.8−1)×100
- Percentage Increase=3.8×100
- Percentage Increase=380%
Therefore, you could interpret the findings as follows:
“The daily use of high-potency cannabis is associated with a nearly five-fold (380%) increased odds of having a psychotic disorder compared to non-users or never users, with a 95% confidence interval ranging from 150% to 530%.”
This interpretation provides a sense of the relative increase in the odds of psychotic disorder associated with daily use of high-potency cannabis, expressed as a percentage.
Problem 4
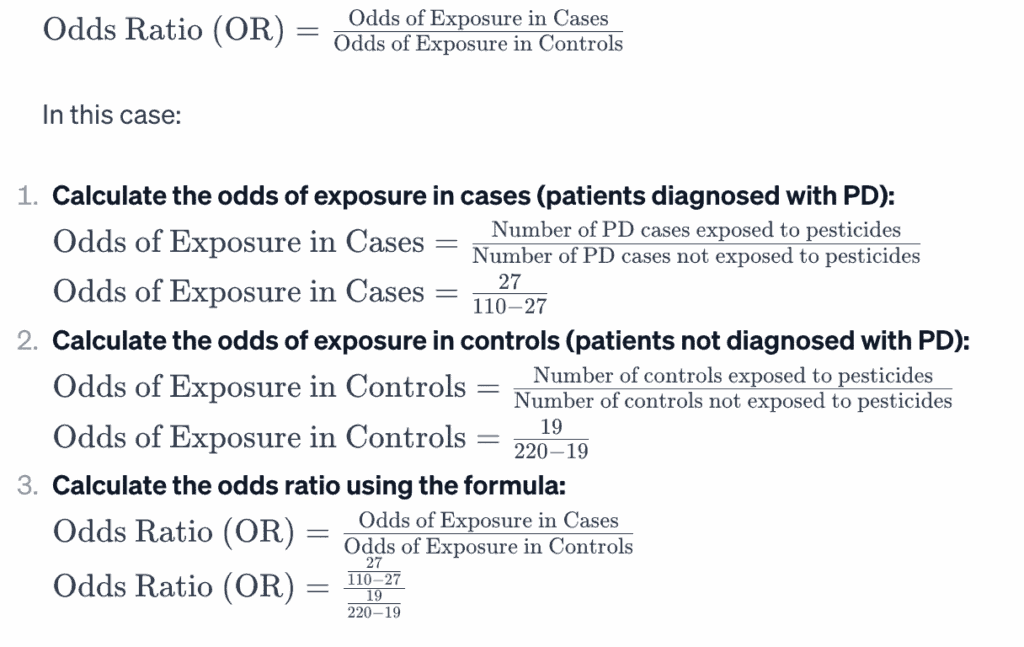
A group of researchers studying the relationship between exposure to pesticides and Parkinson’s disease (PD) in a local population identified 110 patients via chart review diagnosed with PD and 220 patients from the same geographical area who were not diagnosed with PD. Twenty-seven PD-diagnosed patients were exposed to pesticides and 19 subjects were in the control group.
Based on this case-control study, what are the odds that a person exposed to pesticides in this area will be diagnosed with PD?
This study design is consistent with a case-control study. The appropriate measure of association in a case-control study is the odds ratio. The odds ratio is the “measure of association” for a case-control study. It quantifies the relationship between exposure (such as eating food or attending an event) and a disease in a case-control study. The odds ratio is calculated using the number of case patients who did or did not have exposure to a factor (such as a particular food) and the number of controls who did or did not have the exposure. The odds ratio tells us how much higher the odds of exposure are among case patients than among controls.
| Component | Parkinson’s disease | No Parkinson’s disease |
|---|---|---|
|
Exposure to pesticides |
27
|
19
|
|
No exposure to pesticides |
83 |
201 |
The answer is 3.44. Make sure your students write these calculations out!
The odds of a patient with PD who was exposed to pesticides (i.e., exposure odds) is the ratio of the number of patients exposed to pesticides who developed PD (a = 27) to the number of patients without any pesticide exposure who developed PD (c = 83). Similarly, the odds of patients without PD having pesticide exposure is 19 (= b) divided by 201 (= d). The odds ratio of exposure is calculated as (a/c) / (b/d) = ad/bc = (27*201)/(19*83) = 3.44. Based on this study, the odds of a patient with PD being exposed to pesticides are 3.44 times higher than those without pesticide exposure. In case you wanted to see this written out:
Problem 5
An investigator is studying the efficacy of a new pharmaceutical intervention in preventing atherosclerosis in patients above 50 years of age with risk factors for atherosclerosis but no confirmed diagnosis. Participating patients were randomized to either pharmacologic therapy with the new beta blocker or a placebo. The results show that seven patients develop atherosclerosis with pharmacological therapy and 226 do not. Without pharmacological treatment, 23 patients develop atherosclerosis, and 443 do not.
Based on this information, what is the relative risk reduction of atherosclerosis brought about due to pharmacologic therapy in comparison to the control group?
| Component | Atherosclerosis | No atherosclerosis | Total |
|---|---|---|---|
|
Pharmacologic therapy |
7
|
226
|
233
|
|
No pharmacologic therapy |
23 |
443 |
466 |
The value of interest is the relative risk reduction (RRR), which is calculated by subtracting the relative risk (RR) from 1 (i.e., RRR = 1 – RR).
The relative risk (RR) of atherosclerosis in the treatment group compared to the control group is calculated as the risk of atherosclerosis in the treatment group [7/(7 + 226) = 0.030] divided by the risk of atherosclerosis in the control group [23/(23 + 443) = 0.049]. 0.03/0.049 = 0.61 = 61%. The relative risk reduction, RRR = 1 – RR, thus equals 1 – 0.61 = 0.39, indicates a 39% reduction in the risk of atherosclerosis due to the pharmacologic therapy compared to the control.