Left Ventricular Hypertrophy Worksheets

Headshot of Kevin Hodges, Vice Chair, Emergency Medicine
Kevin Hodges
Vice Chair, Emergency Medicine
envelope icon phone icon
Headshot of Chris Anderson, Vice Chair, Pediatrics
Chris Anderson
Vice Chair, Pediatrics
envelope icon

These worksheets are for self-study only. Answers will not be evaluated.

Instructions for Chapter 17 Worksheets

  1. Make basic measurements and evaluate for ischemia, infarction, and atrial abnormality.
  2. Diagnose LVH if criteria listed in Chapter 17 are present.
  3. Evaluate clinically.


Clinically-Based Critical Thinking: Interpretation

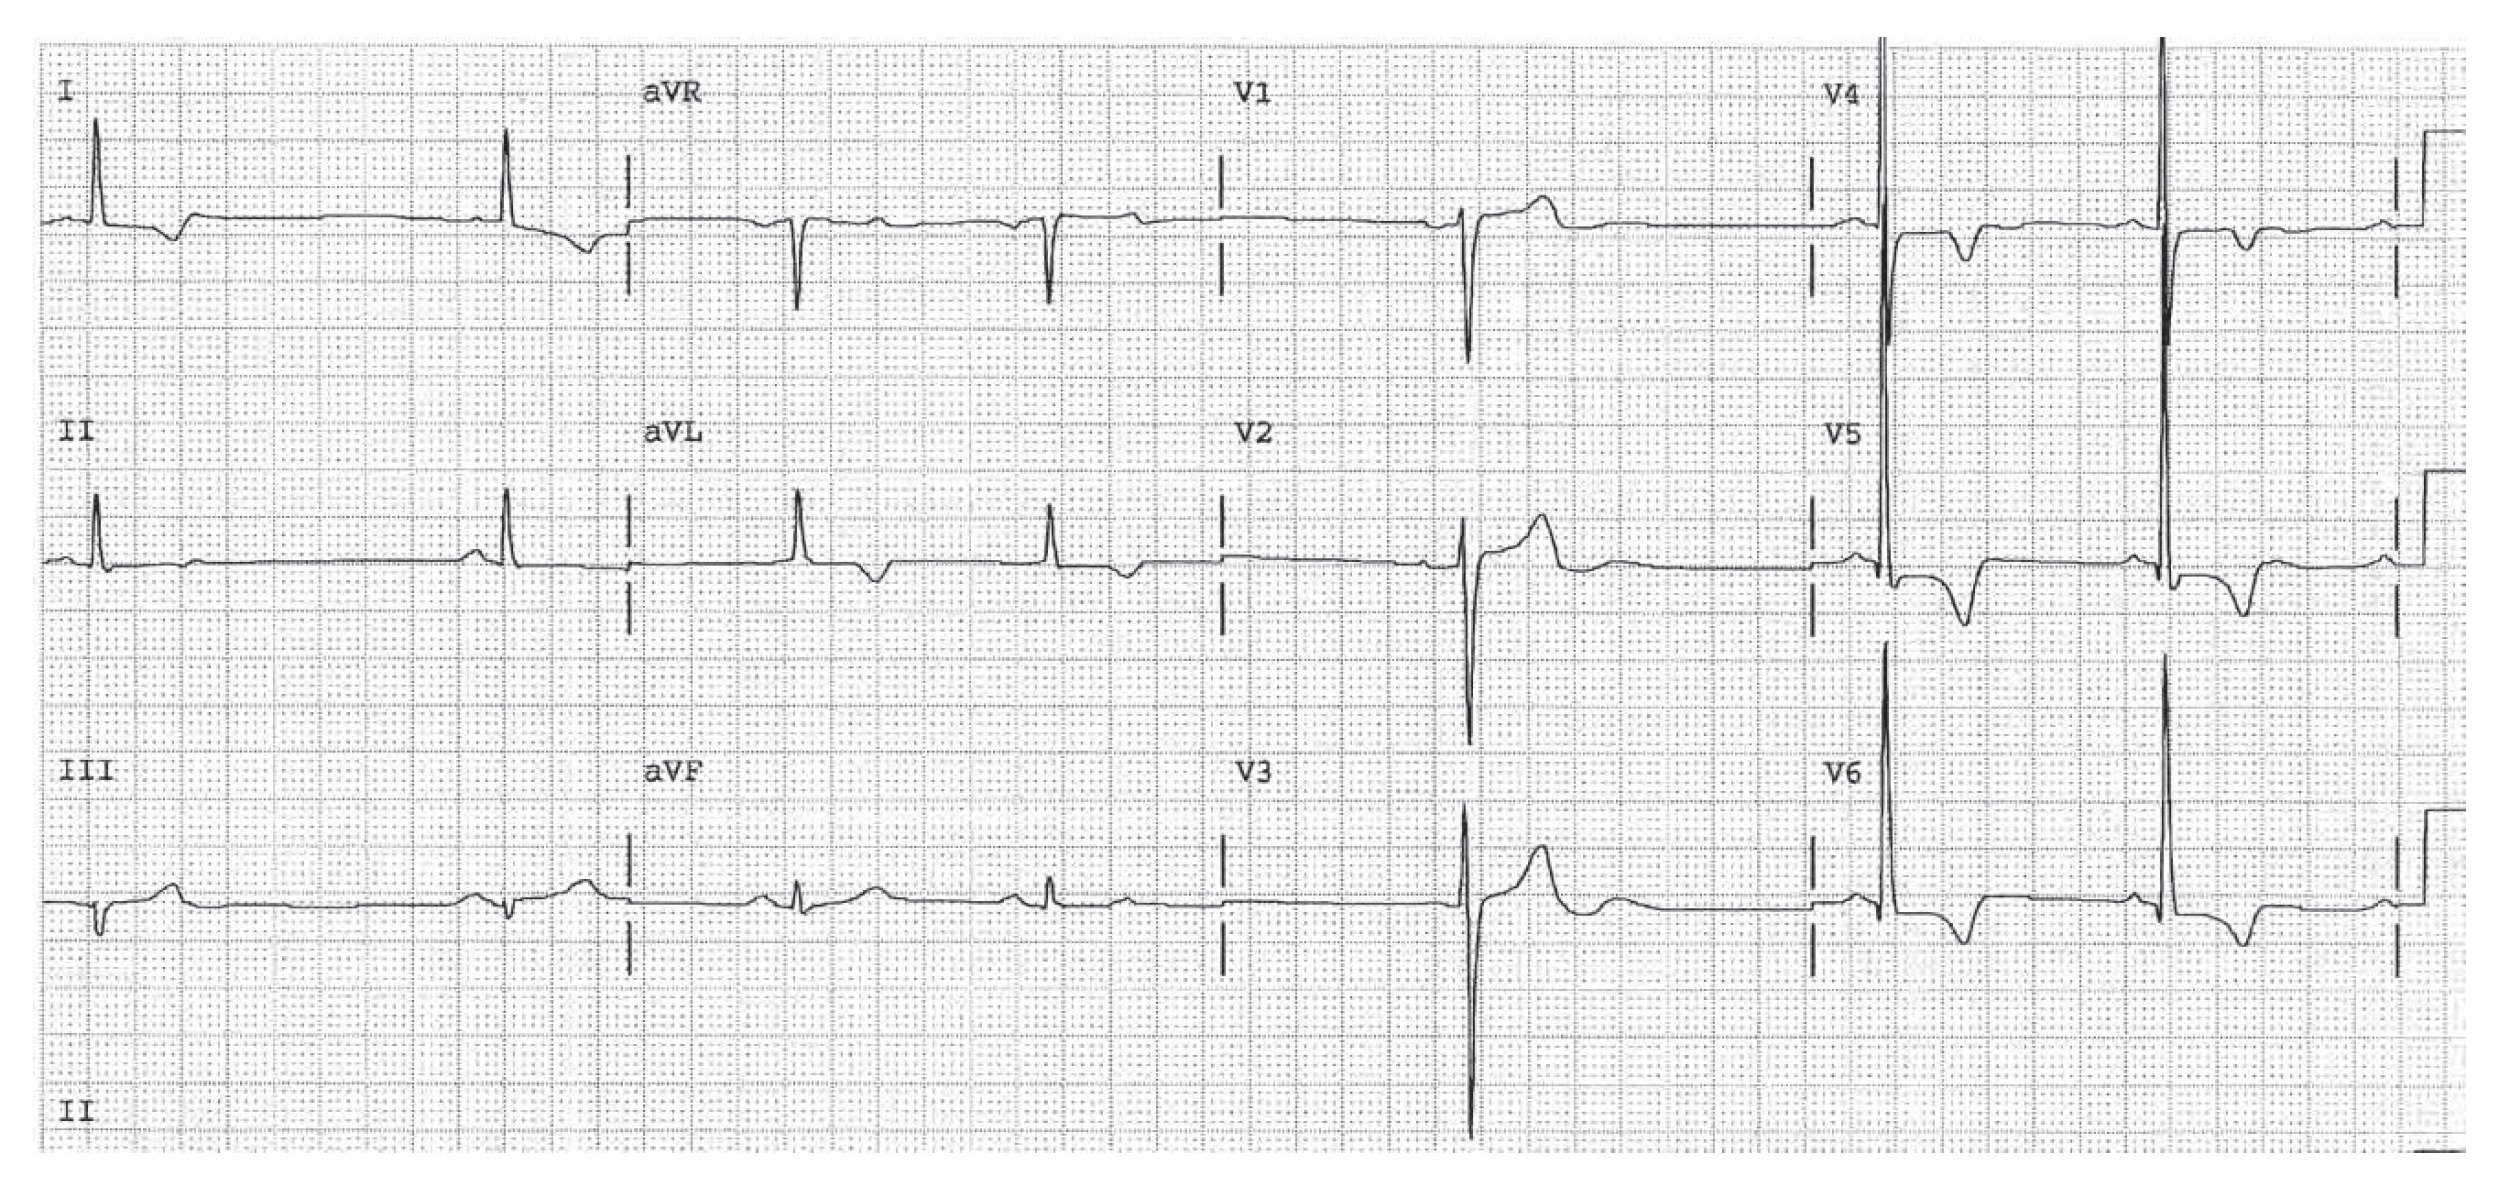
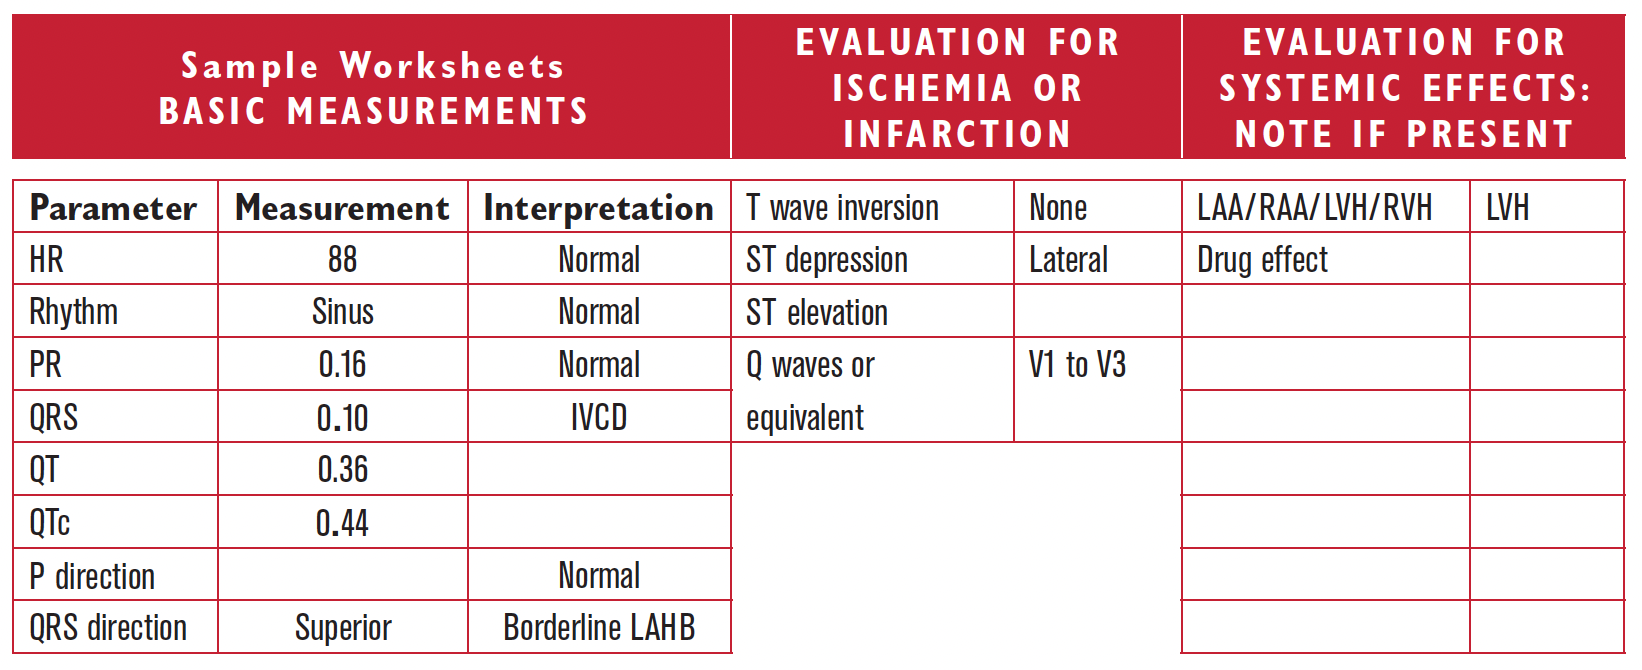
LVH is present by voltage since RI + SIII = 25. There are Q waves (this is not poor R wave progression; these are Q waves) in V1, V2, and V3, and so Q wave infarction criteria of the septum and anterior wall are present as well. A careful inspection of leads I, V5, and V6 shows ST segment depression, which may be due to LVH or to ischemia or infarction. Possible associations include HTN, poorly controlled, with coexistent coronary disease.

Worksheet 17.1

Complete the basic measurements, diagnose LVH, and evaluate clinically.

Parameter Measurement Interpretation
HR    
Rhythm    
PR    
QRS    
QT    
QTc    
P direction    
QRS direction    
Abnormal parameter If present, note the leads or location
Inverted T waves  
ST depression  
ST elevation  
Q waves or equivalents  
Systemic effects If present, note 
LAA/RAA/LVH/RVH  
Drug effect  
SI/QT III pattern  

Sinus bradycardia. PAC’s are present, which are nonconducted, leading to pauses. There are voltage  criteria for LVH. There is ST segment depression. This may be due to LVH, ischemia, or infarction. The most likely cause of LVH is hypertension, which is also a primary risk factor for the development of coronary artery disease. The presence of LVH would indicate the development of hypertensive heart disease. Other causes of LVH are pressure and volume overload states on the left ventricle. Although the ST segments may be secondary to LVH, they may also represent ischemia or infarction (First Rule of T waves). More information is necessary.

Worksheet 17.2

Complete the basic measurements, diagnose LVH, and evaluate clinically.

Parameter Measurement Interpretation
HR    
Rhythm    
PR    
QRS    
QT    
QTc    
P direction    
QRS direction    
Abnormal parameter If present, note the leads or location
Inverted T waves  
ST depression  
ST elevation  
Q waves or equivalents  
Systemic effects If present, note 
LAA/RAA/LVH/RVH  
Drug effect  
SI/QT III pattern  

HR 88. Sinus rhythm. Right atrial abnormality. Left atrial abnormality. LVH. ST changes consistent with LVH or ischemia or infarction.

Worksheet 17.3

Complete the basic measurements, diagnose LVH, and evaluate clinically.

Parameter Measurement Interpretation
HR    
Rhythm    
PR    
QRS    
QT    
QTc    
P direction    
QRS direction    
Abnormal parameter If present, note the leads or location
Inverted T waves  
ST depression  
ST elevation  
Q waves or equivalents  
Systemic effects If present, note 
LAA/RAA/LVH/RVH  
Drug effect  
SI/QT III pattern  

HR 60. Sinus rhythm. LVH. Diffuse nonspecific ST changes consistent with LVH or ischemia or infarction. (Check the ST in III and V6 with a straight edge.)