These worksheets are for self-study only. Answers will not be evaluated.
Instructions for this review
- Complete basic measurements.
- Do all previous work.
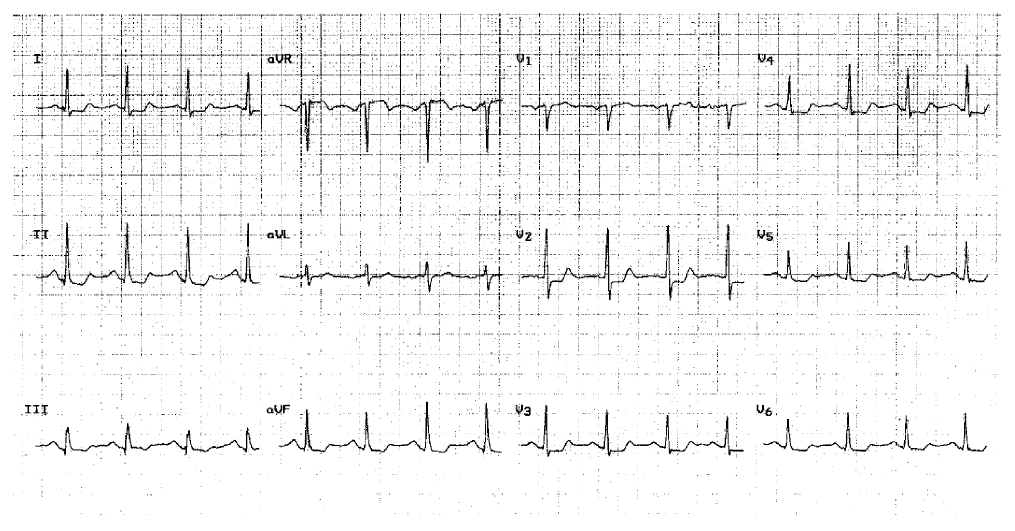
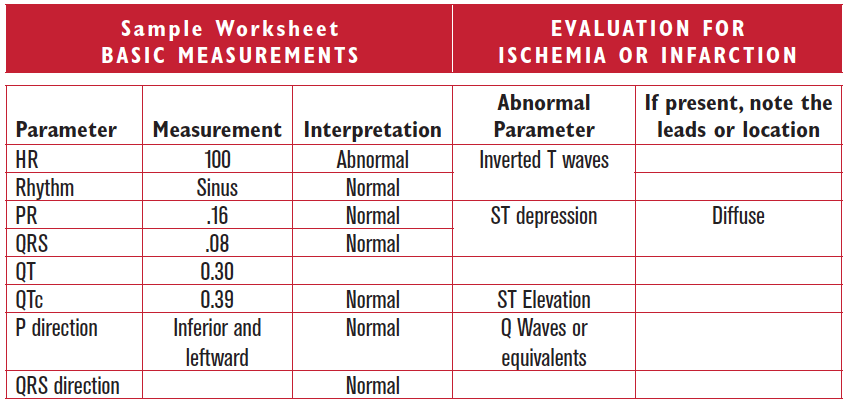
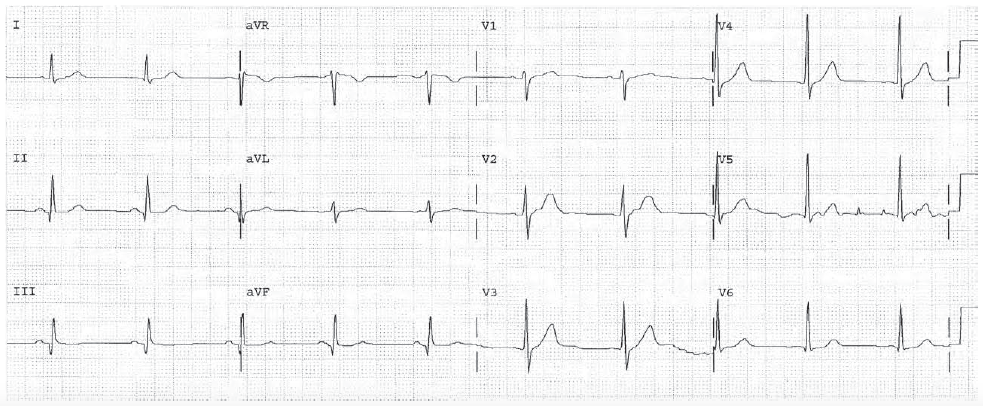
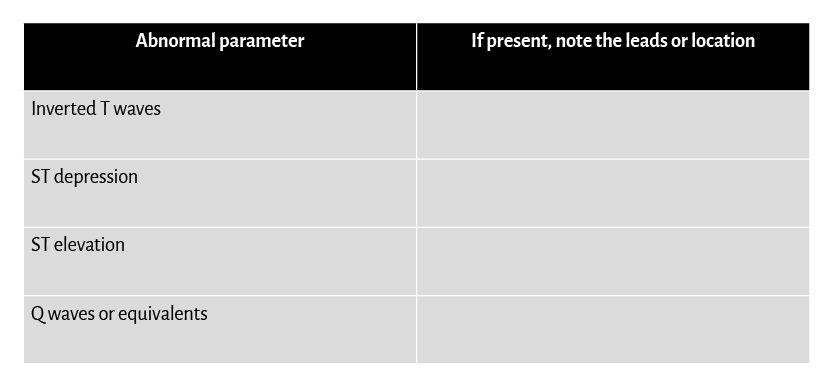
- Note if inverted T waves or ST segment depression is present in two or more leads that represent a pattern in Table 13.2. Here the ST segments are diffusely abnormal.
- Provide an interpretation.
Clinically-Based Critical Thinking: Interpretation
ST segment depression is consistent with ischemia or infarction. On a single EKG, the First Rule of the T Wave applies. The ST depression may represent infarction, which may be new or old. It may also represent ischemia. More information is needed. Is the patient symptomatic? Is there an old EKG available? If so, are these ST changes new?
Worksheet V.1
Complete the basic measurements, evaluation, and interpretation for the EKG below.
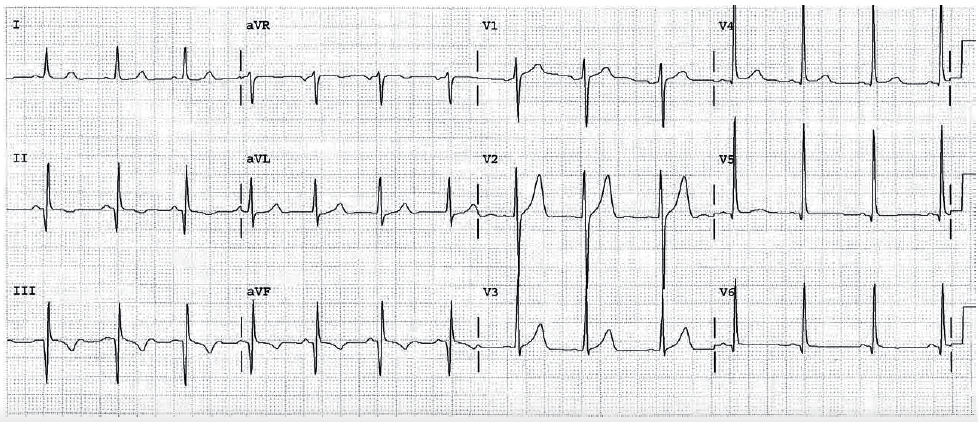
HR 60 Sinus rhythm. Normal PR and QRS intervals. Normal QT and QTc. Normal P and overall QRS direction. Q waves are present in leads II, III, and AVF. The Q wave in lead II is borderline, but significant in leads III and AVF. There is a wide tall R wave in lead V2 equivalent to a posterior Q wave. This indicates an inferior posterior infarction. The ST segments are normal, so the infarction may be old.
Worksheet V.2
Complete the basic measurements, evaluation, and interpretation for the EKG below.
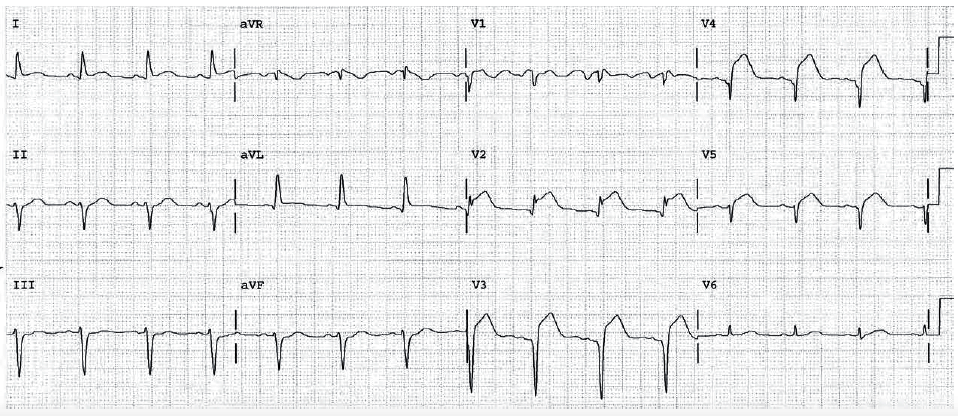
HR 83. Rhythm sinus. PR and QRS intervals are normal. QT and QTc are normal. ST elevation in leads V2 through V5 takes precedence over everything else. It indicates STEMI. The Q waves indicate infarction and some permanent loss of LV has already occurred.
Worksheet V.3
Complete the basic measurements, evaluation, and interpretation for the EKG below.
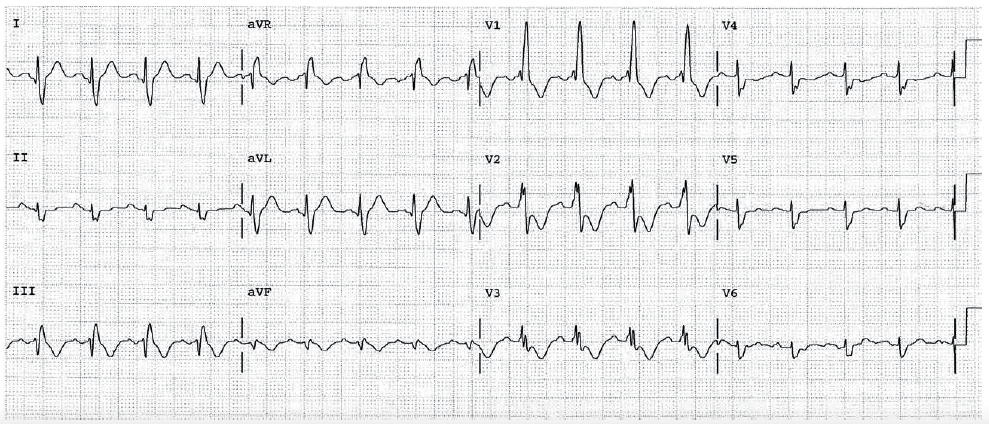
HR 103, sinus tachycardia. PR 0.18 normal. The QRS is 0.12 indicating BBB. The end of the QRS is right and anterior indicating RBBB. The overall QRS points to the right indicating LPHB. The ST segments are abnormal in V2 through V6 consistent with ischemia or infarction. The ST segments in RBBB point typically away from the end of the QRS. In this example, the ST segments are not secondary to RBBB, but suggest ischemia or infarction (Rule I). The ST segments should always be checked in RBBB.
Worksheet V.4
Complete the basic measurements, evaluation, and interpretation for the EKG below.
HR 81. Sinus rhythm. Significant Q waves are present in II, III, and AVF. The tall wide R wave in lead V2 is equivalent to a posterior Q wave. The ST segments suggest the timing of the Q waves is recent. If this is the only EKG, The First Rule of the T Waves still raises the possibility that the ST segment changes are new, representing new infarction, or angina.
Worksheet V.5
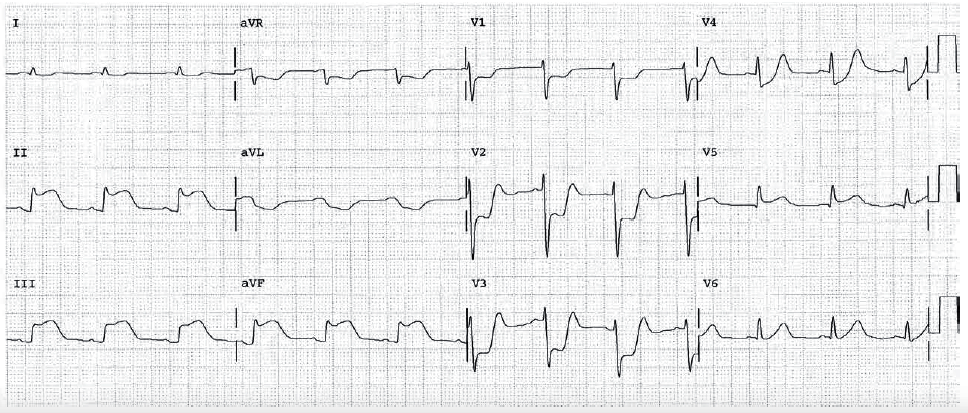
Complete the basic measurements, evaluation, and interpretation for the EKG below.
HR 75, Sinus Rhythm. PR normal. QRS normal. ST Elevation in II, III, and AVF. The ST depression in leads V2 through V4 may represent a posterior ST elevation equivalent. Regardless, Rule Three of the T Waves applies. Since ST elevation is present in two contiguous leads, it takes precedence over the ST segment depression. Therapy should be directed immediately to opening the closed artery.


