


These worksheets are for self-study only. Answers will not be evaluated.
Worksheet 1
Complete the basic measurements, evaluate for ischemia, infarction, and hypertrophy, diagnose clinical condition, and evaluate clinically.
| Parameter | Measurement | Interpretation |
| HR | ||
| Rhythm | ||
| PR | ||
| QRS | ||
| QT | ||
| QTc | ||
| P direction | ||
| QRS direction |
| Abnormal parameter | If present, note the leads or location |
| Inverted T waves | |
| ST depression | |
| ST elevation | |
| Q waves or equivalents |
| Systemic effects | If present, note |
| LAA/RAA/LVH/RVH | |
| Drug effect | |
| Hyper/hypokalemia | |
| Hyper/hypocalcemia | |
| Low voltage | |
| SI/QT III pattern | |
| Pericarditis |
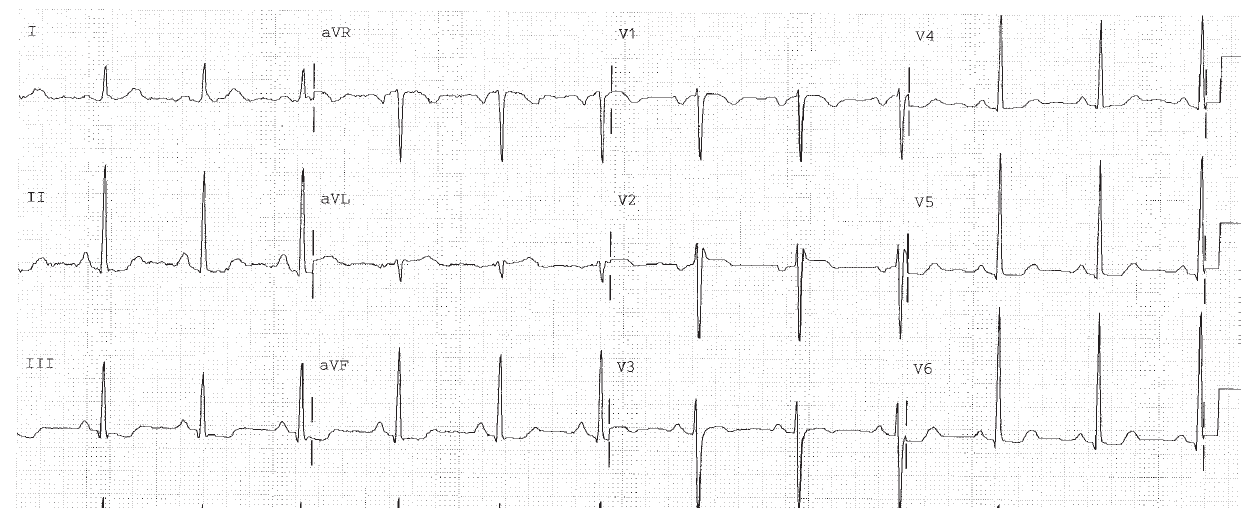
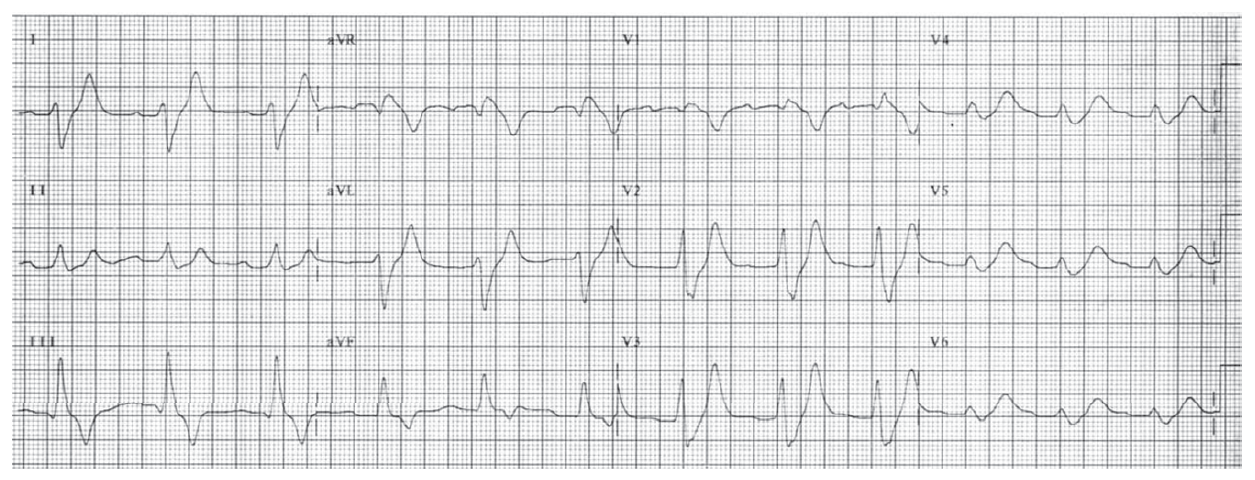
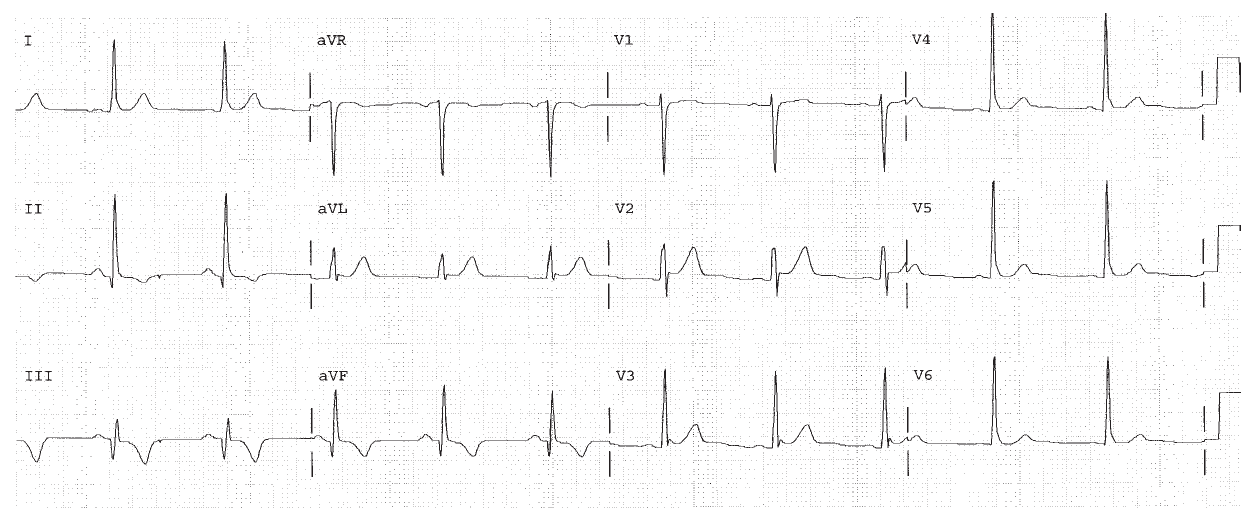
Sinus rhythm. Rate 71. PR 0.18. QRS 0.10, IVCD. Right atrial abnormality. Left atrial abnormality. LVH. Pressure or volume overload of the LV, most commonly due to hypertension. Diffuse ST changes due to LVH or ischemia or infarction.
Worksheet 2
Complete the basic measurements, evaluate for ischemia, infarction, and hypertrophy, diagnose clinical condition, and evaluate clinically.
| Parameter | Measurement | Interpretation |
| HR | ||
| Rhythm | ||
| PR | ||
| QRS | ||
| QT | ||
| QTc | ||
| P direction | ||
| QRS direction |
| Abnormal parameter | If present, note the leads or location |
| Inverted T waves | |
| ST depression | |
| ST elevation | |
| Q waves or equivalents |
| Systemic effects | If present, note |
| LAA/RAA/LVH/RVH | |
| Drug effect | |
| Hyper/hypokalemia | |
| Hyper/hypocalcemia | |
| Low voltage | |
| SI/QT III pattern | |
| Pericarditis |
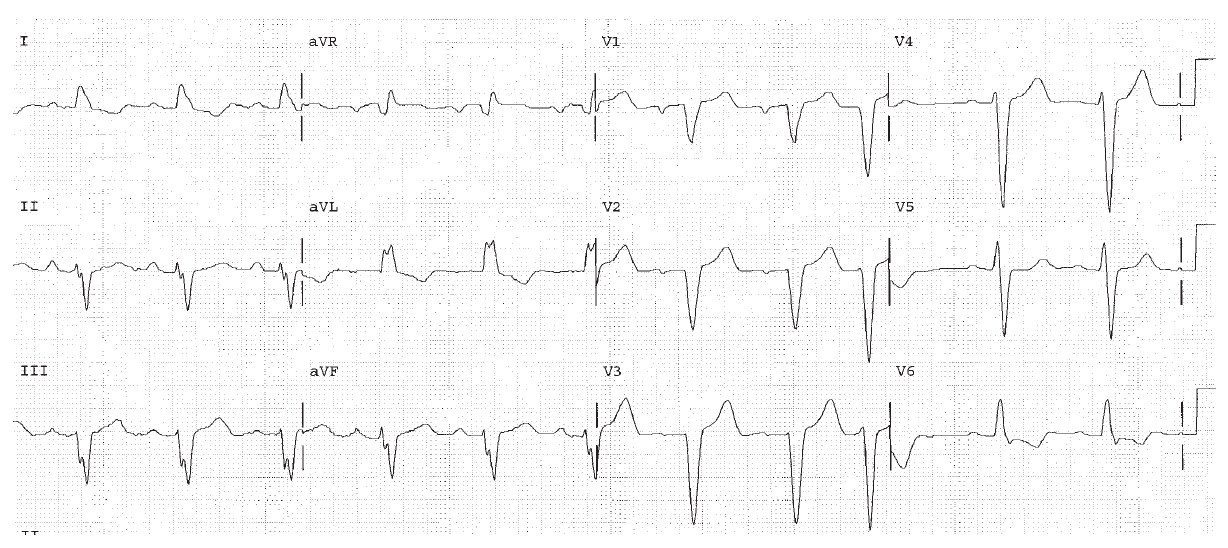
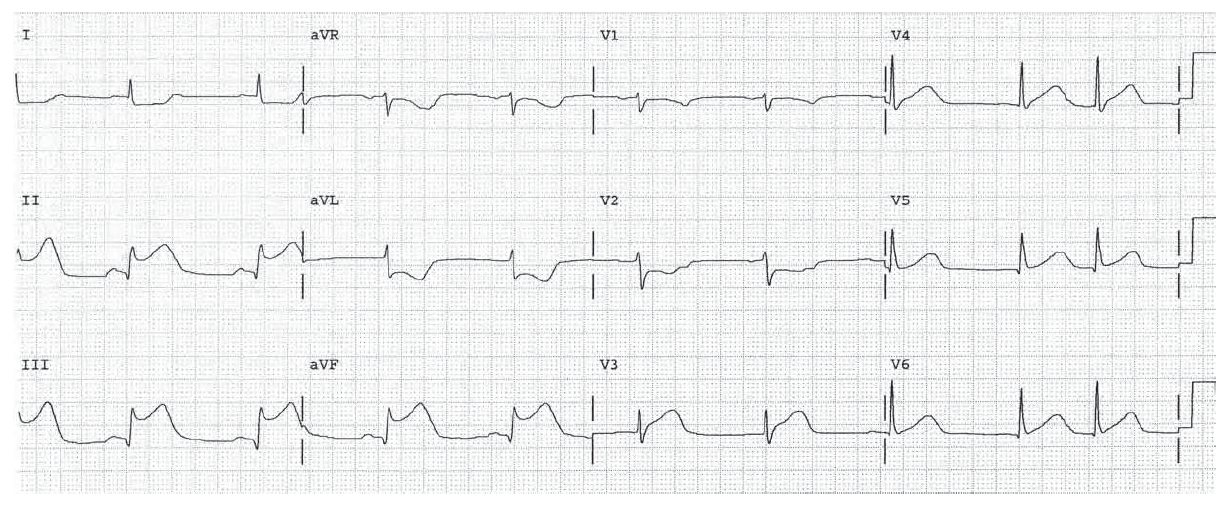
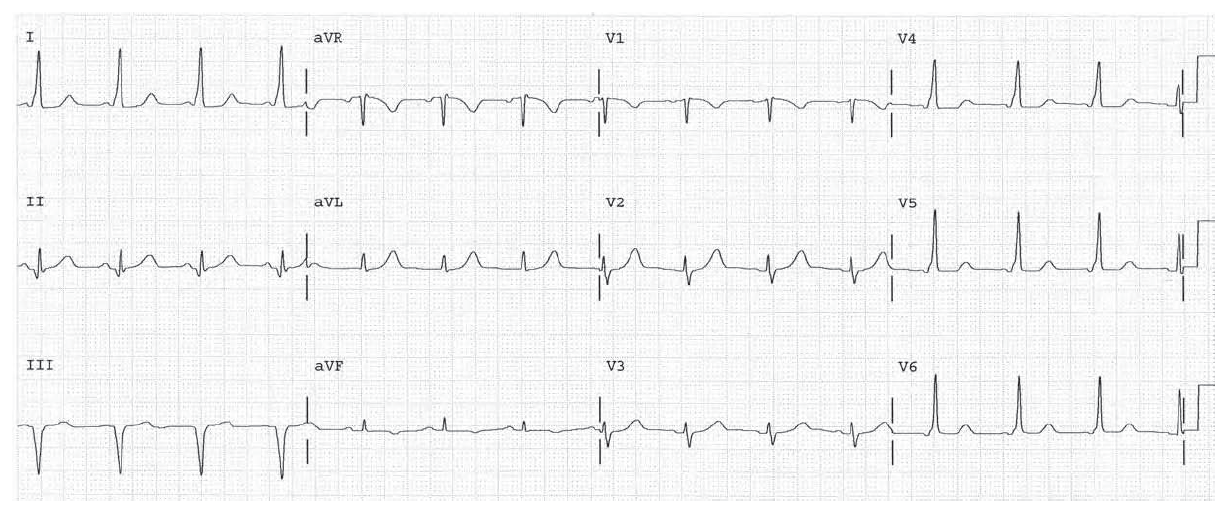
1°AV Block, LBBB. Associations include coronary disease, hypertension, and cardiomyopathy.
Worksheet 3
Complete the basic measurements, evaluate for ischemia, infarction, and hypertrophy, diagnose clinical condition, and evaluate clinically.
| Parameter | Measurement | Interpretation |
| HR | ||
| Rhythm | ||
| PR | ||
| QRS | ||
| QT | ||
| QTc | ||
| P direction | ||
| QRS direction |
| Abnormal parameter | If present, note the leads or location |
| Inverted T waves | |
| ST depression | |
| ST elevation | |
| Q waves or equivalents |
| Systemic effects | If present, note |
| LAA/RAA/LVH/RVH | |
| Drug effect | |
| Hyper/hypokalemia | |
| Hyper/hypocalcemia | |
| Low voltage | |
| SI/QT III pattern | |
| Pericarditis |
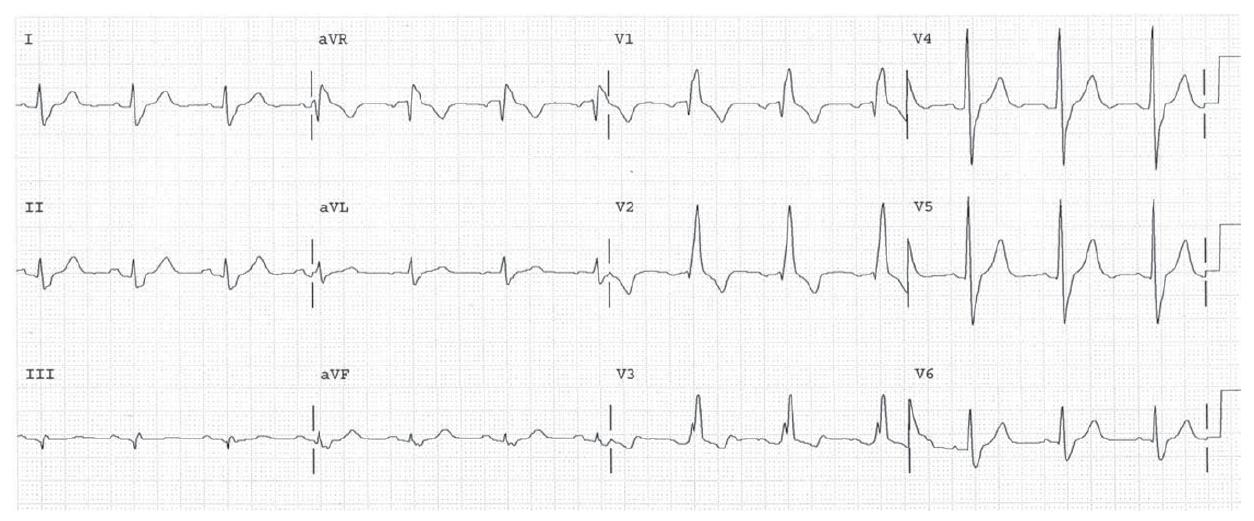
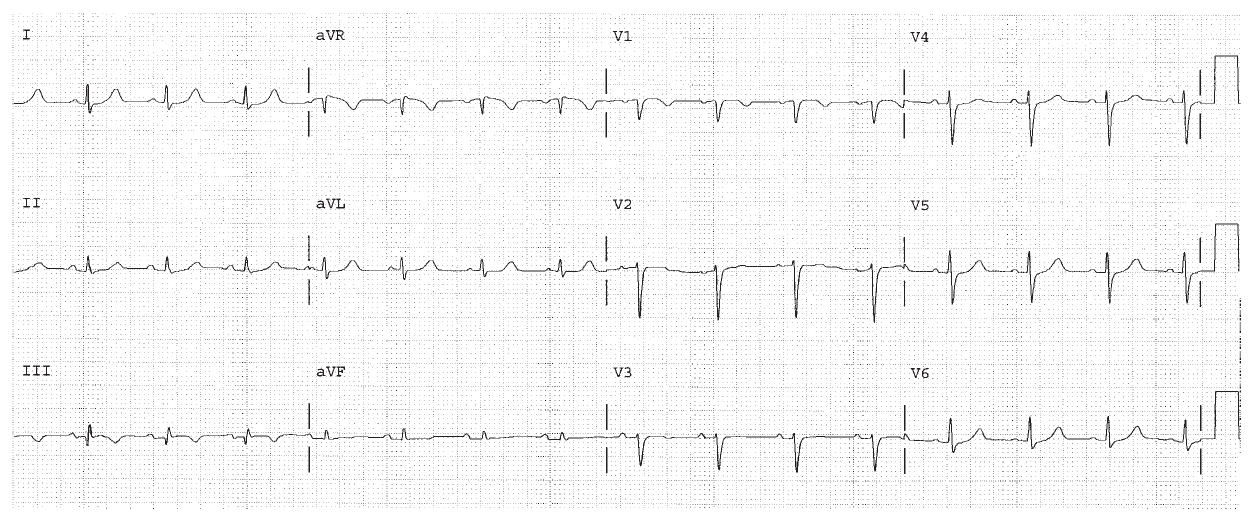
RBBB. LPHB. ST changes are expected for RBBB.
Worksheet 4
Complete the basic measurements, evaluate for ischemia, infarction, and hypertrophy, diagnose clinical condition, and evaluate clinically.
| Parameter | Measurement | Interpretation |
| HR | ||
| Rhythm | ||
| PR | ||
| QRS | ||
| QT | ||
| QTc | ||
| P direction | ||
| QRS direction |
| Abnormal parameter | If present, note the leads or location |
| Inverted T waves | |
| ST depression | |
| ST elevation | |
| Q waves or equivalents |
| Systemic effects | If present, note |
| LAA/RAA/LVH/RVH | |
| Drug effect | |
| Hyper/hypokalemia | |
| Hyper/hypocalcemia | |
| Low voltage | |
| SI/QT III pattern | |
| Pericarditis |
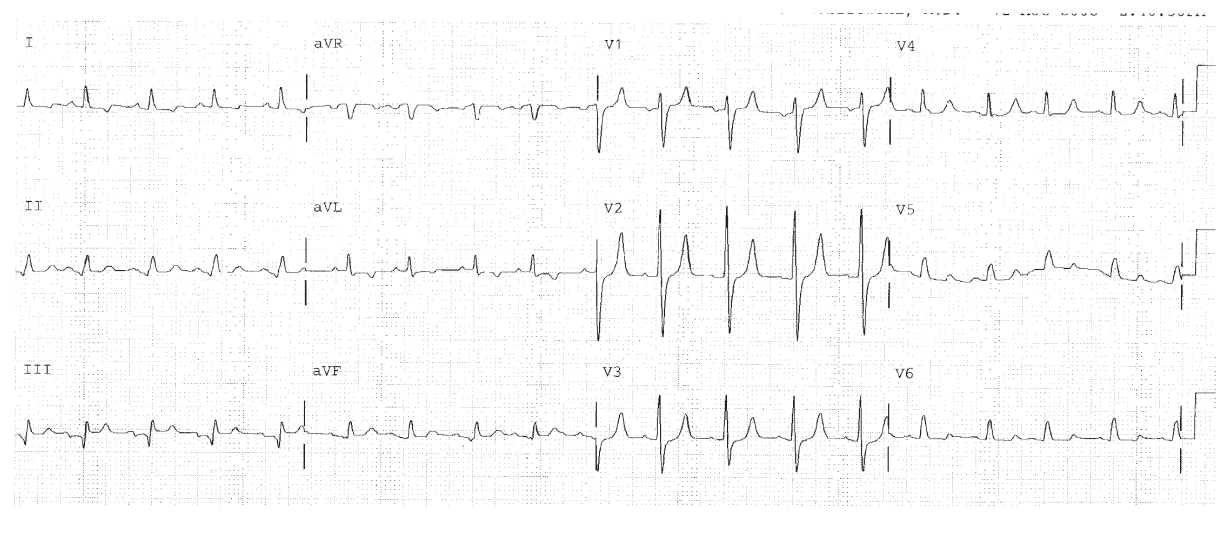
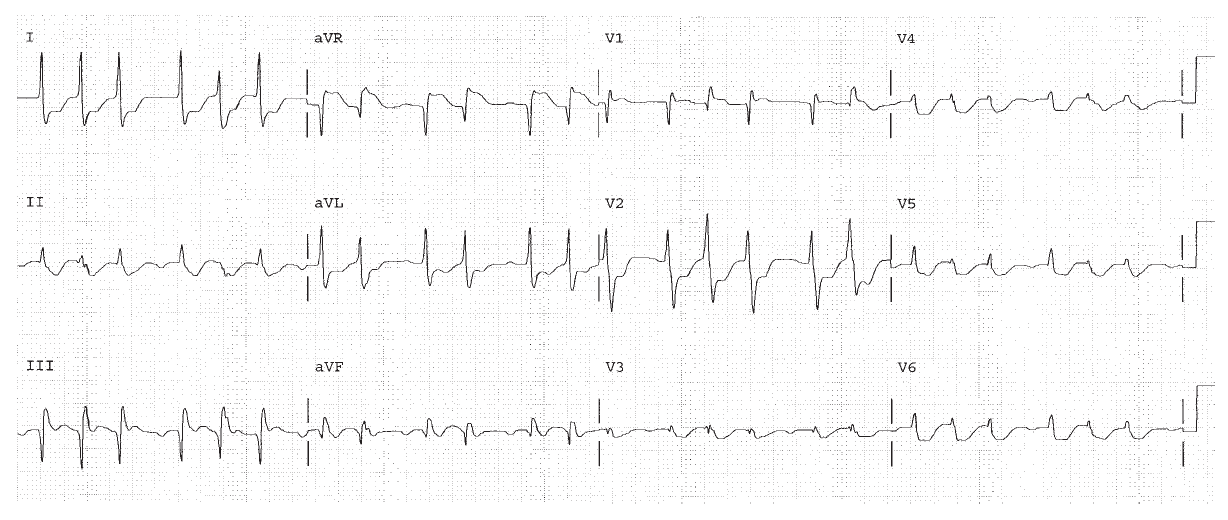
Peaked T waves indicate hyperkalemia. (K+ was 7.8).
Worksheet 5
Complete the basic measurements, evaluate for ischemia, infarction, and hypertrophy, diagnose clinical condition, and evaluate clinically.
| Parameter | Measurement | Interpretation |
| HR | ||
| Rhythm | ||
| PR | ||
| QRS | ||
| QT | ||
| QTc | ||
| P direction | ||
| QRS direction |
| Abnormal parameter | If present, note the leads or location |
| Inverted T waves | |
| ST depression | |
| ST elevation | |
| Q waves or equivalents |
| Systemic effects | If present, note |
| LAA/RAA/LVH/RVH | |
| Drug effect | |
| Hyper/hypokalemia | |
| Hyper/hypocalcemia | |
| Low voltage | |
| SI/QT III pattern | |
| Pericarditis |
Sine wave of hyperkalemia. (K+ was 8.5).
Worksheet 6
Complete the basic measurements, evaluate for ischemia, infarction, and hypertrophy, diagnose clinical condition, and evaluate clinically.
| Parameter | Measurement | Interpretation |
| HR | ||
| Rhythm | ||
| PR | ||
| QRS | ||
| QT | ||
| QTc | ||
| P direction | ||
| QRS direction |
| Abnormal parameter | If present, note the leads or location |
| Inverted T waves | |
| ST depression | |
| ST elevation | |
| Q waves or equivalents |
| Systemic effects | If present, note |
| LAA/RAA/LVH/RVH | |
| Drug effect | |
| Hyper/hypokalemia | |
| Hyper/hypocalcemia | |
| Low voltage | |
| SI/QT III pattern | |
| Pericarditis |
Sinus rhythm with PAC and ST elevation in the inferior, anterior, and lateral walls. Rule Three of the T Waves. The ST elevation takes precedence over the ST segment depression (which represents reciprocal changes). Immediate evaluation for possible angioplasty or thrombolysis is appropriate (STEMI).
Worksheet 7
Complete the basic measurements, evaluate for ischemia, infarction, and hypertrophy, diagnose clinical condition, and evaluate clinically.
| Parameter | Measurement | Interpretation |
| HR | ||
| Rhythm | ||
| PR | ||
| QRS | ||
| QT | ||
| QTc | ||
| P direction | ||
| QRS direction |
| Abnormal parameter | If present, note the leads or location |
| Inverted T waves | |
| ST depression | |
| ST elevation | |
| Q waves or equivalents |
| Systemic effects | If present, note |
| LAA/RAA/LVH/RVH | |
| Drug effect | |
| Hyper/hypokalemia | |
| Hyper/hypocalcemia | |
| Low voltage | |
| SI/QT III pattern | |
| Pericarditis |
SI Q T III pattern of pulmonary embolism.
Worksheet 8
Complete the basic measurements, evaluate for ischemia, infarction, and hypertrophy, diagnose clinical condition, and evaluate clinically.
| Parameter | Measurement | Interpretation |
| HR | ||
| Rhythm | ||
| PR | ||
| QRS | ||
| QT | ||
| QTc | ||
| P direction | ||
| QRS direction |
| Abnormal parameter | If present, note the leads or location |
| Inverted T waves | |
| ST depression | |
| ST elevation | |
| Q waves or equivalents |
| Systemic effects | If present, note |
| LAA/RAA/LVH/RVH | |
| Drug effect | |
| Hyper/hypokalemia | |
| Hyper/hypocalcemia | |
| Low voltage | |
| SI/QT III pattern | |
| Pericarditis |
Atrial fibrillation. SI Q T III pattern. Anterior ST depression indicates septal or right ventricular free wall ischemia.
Worksheet 9
Complete the basic measurements, evaluate for ischemia, infarction, and hypertrophy, diagnose clinical condition, and evaluate clinically.
| Parameter | Measurement | Interpretation |
| HR | ||
| Rhythm | ||
| PR | ||
| QRS | ||
| QT | ||
| QTc | ||
| P direction | ||
| QRS direction |
| Abnormal parameter | If present, note the leads or location |
| Inverted T waves | |
| ST depression | |
| ST elevation | |
| Q waves or equivalents |
| Systemic effects | If present, note |
| LAA/RAA/LVH/RVH | |
| Drug effect | |
| Hyper/hypokalemia | |
| Hyper/hypocalcemia | |
| Low voltage | |
| SI/QT III pattern | |
| Pericarditis |
Inferior Q waves indicate inferior Q wave infarction, possibly recent since the ST segments are abnormal. Wide R wave in V2 indicates posterior MI or RVH.
Worksheet 10
Complete the basic measurements, evaluate for ischemia, infarction, and hypertrophy, diagnose clinical condition, and evaluate clinically.
| Parameter | Measurement | Interpretation |
| HR | ||
| Rhythm | ||
| PR | ||
| QRS | ||
| QT | ||
| QTc | ||
| P direction | ||
| QRS direction |
| Abnormal parameter | If present, note the leads or location |
| Inverted T waves | |
| ST depression | |
| ST elevation | |
| Q waves or equivalents |
| Systemic effects | If present, note |
| LAA/RAA/LVH/RVH | |
| Drug effect | |
| Hyper/hypokalemia | |
| Hyper/hypocalcemia | |
| Low voltage | |
| SI/QT III pattern | |
| Pericarditis |
Delta wave and short PR interval indicate WPW.