These worksheets are for self-study only. Answers will not be evaluated.
Instructions for Chapter 16 Worksheets
- Make basic measurements and evaluate for ischemia and infarction.
- Diagnose right or left atrial abnormality based on the criteria in Chapter 16.
- Evaluate clinically.
Clinically-Based Critical Thinking: Interpretation
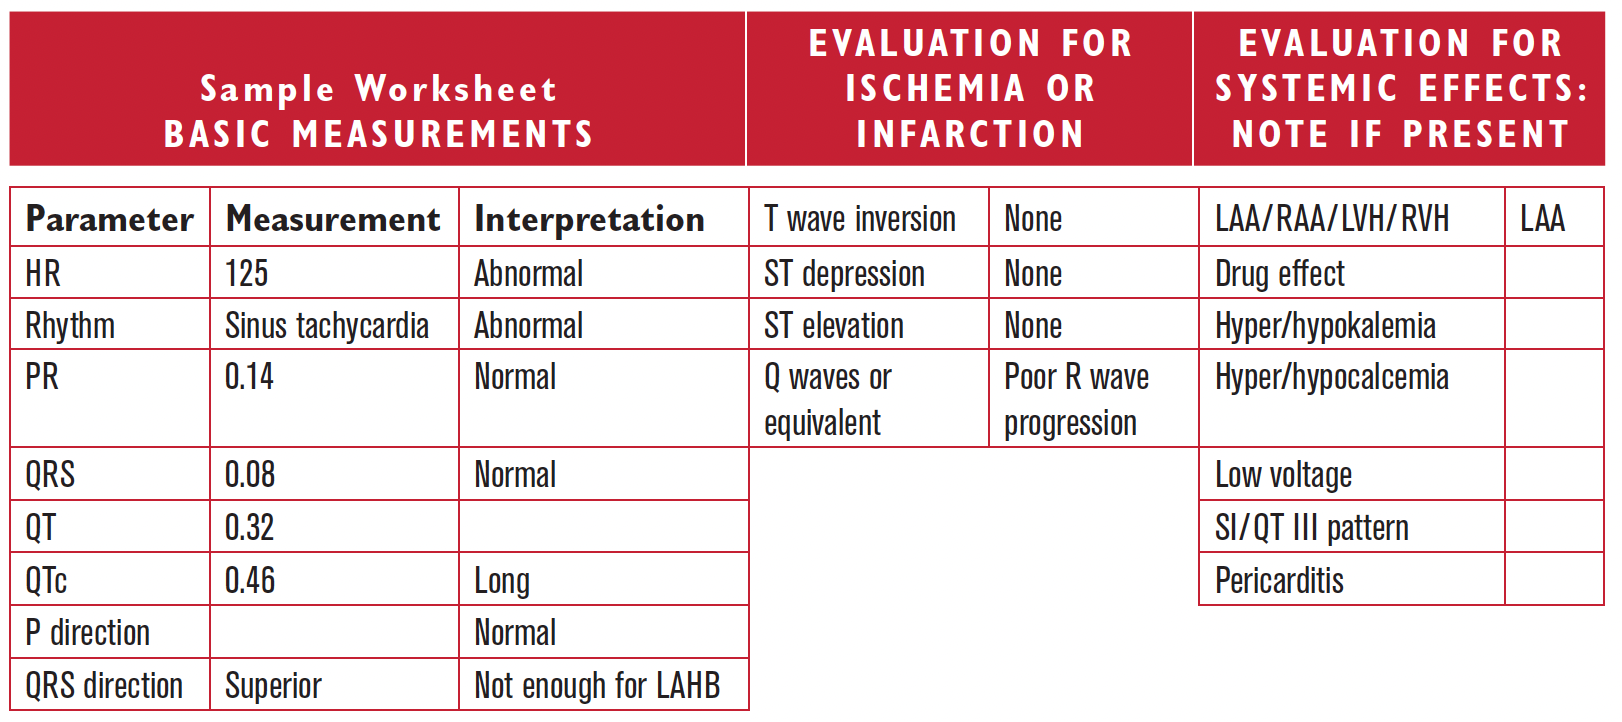
Sinus tachycardia is present and suggests sympathetic stimulation. Medications and electrolyte values should be checked to explain the long QTc. Poor R wave progression could be the result of underlying infarction or lung disease. It is not a specific finding and needs to be evaluated clinically. Left atrial abnormality is present, which may be due to left ventricular disease such as hypertensive heart disease, or systolic or diastolic heart failure. LAA can also be associated with mitral stenosis or regurgitation.
Worksheet 16.1
Complete the basic measurements, diagnose right or left atrial abnormality, and evaluate clinically.
Parameter | Measurement | Interpretation |
HR | ||
Rhythm | ||
PR | ||
QRS | ||
QT | ||
QTc | ||
P direction | ||
QRS direction |
Abnormal parameter | If present, note the leads or location |
Inverted T waves | |
ST depression | |
ST elevation | |
Q waves or equivalents |
Systemic effects | If present, note |
LAA/RAA/LVH/RVH | |
Drug effect | |
SI/QT III pattern |
HR 115 sinus tachycardia. PR interval is 0.12 seconds. The QRS is 0.08, normal. The QT measures 0.32. The QTc is 0.44 which is high. The P direction is normal. The QRS direction is upward, indicating LAHB. There are tall P waves in leads II, III, and AVF indicating right atrial abnormality. There is a borderline left atrial abnormality as well. There is poor R wave progression in leads V1 to V3. This may represent infarction or may possibly be due to COPD.
Worksheet 16.2
Complete the basic measurements, diagnose right or left atrial abnormality, and evaluate clinically.
Parameter | Measurement | Interpretation |
HR | ||
Rhythm | ||
PR | ||
QRS | ||
QT | ||
QTc | ||
P direction | ||
QRS direction |
Abnormal parameter | If present, note the leads or location |
Inverted T waves | |
ST depression | |
ST elevation | |
Q waves or equivalents |
Systemic effects | If present, note |
LAA/RAA/LVH/RVH | |
Drug effect | |
SI/QT III pattern |
Sinus tachycardia, rate 107. Normal PR and QRS intervals. Normal P direction. QRS direction is leftward but not inferior, which is nonspecific. There are tall P waves in leads II, III, and AVF indicating right atrial abnormality. There is ST segment depression in leads V2 through V4. If only this EKG is available the ST segment changes may represent ischemia or infarction, and may be new or old. More information is necessary (First Rule of T Waves).
Worksheet 16.3
Complete the basic measurements, diagnose right or left atrial abnormality, and evaluate clinically.
Parameter | Measurement | Interpretation |
HR | ||
Rhythm | ||
PR | ||
QRS | ||
QT | ||
QTc | ||
P direction | ||
QRS direction |
Abnormal parameter | If present, note the leads or location |
Inverted T waves | |
ST depression | |
ST elevation | |
Q waves or equivalents |
Systemic effects | If present, note |
LAA/RAA/LVH/RVH | |
Drug effect | |
SI/QT III pattern |
HR 71. Rhythm sinus. PR interval is 0.20 seconds. QRS interval is 0.09 seconds. The QT is 0.40. The QTc is normal. The P direction and QRS direction are normal. There are diffuse ST segment changes. (Check the ST in III and V6 with a straight edge.) On a single EKG they may represent ischemia or infarction, and be new or old. There are criteria for both right and left atrial abnormalities.