


Digitalis is one of the oldest and most commonly used cardiac medications. In therapeutic doses, digitalis effectively slows the SA node from firing as often, slows conduction through the AV node, and increases contractility. When the blood levels of digitalis exceed the therapeutic range, lethal dysrhythmia and EKG changes can occur. Digitalis toxicity produces various heart blocks, as well as ventricular dysrhythmias such as ventricular bigeminy and ventricular tachycardia.
Digitalis Toxicity
Digitalis toxicity produces a characteristic down sloping of the ST segment on the EKG (Figure 19.2).
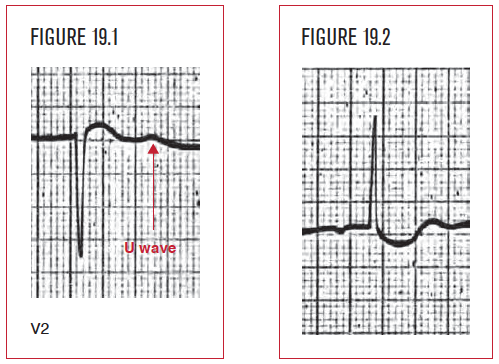
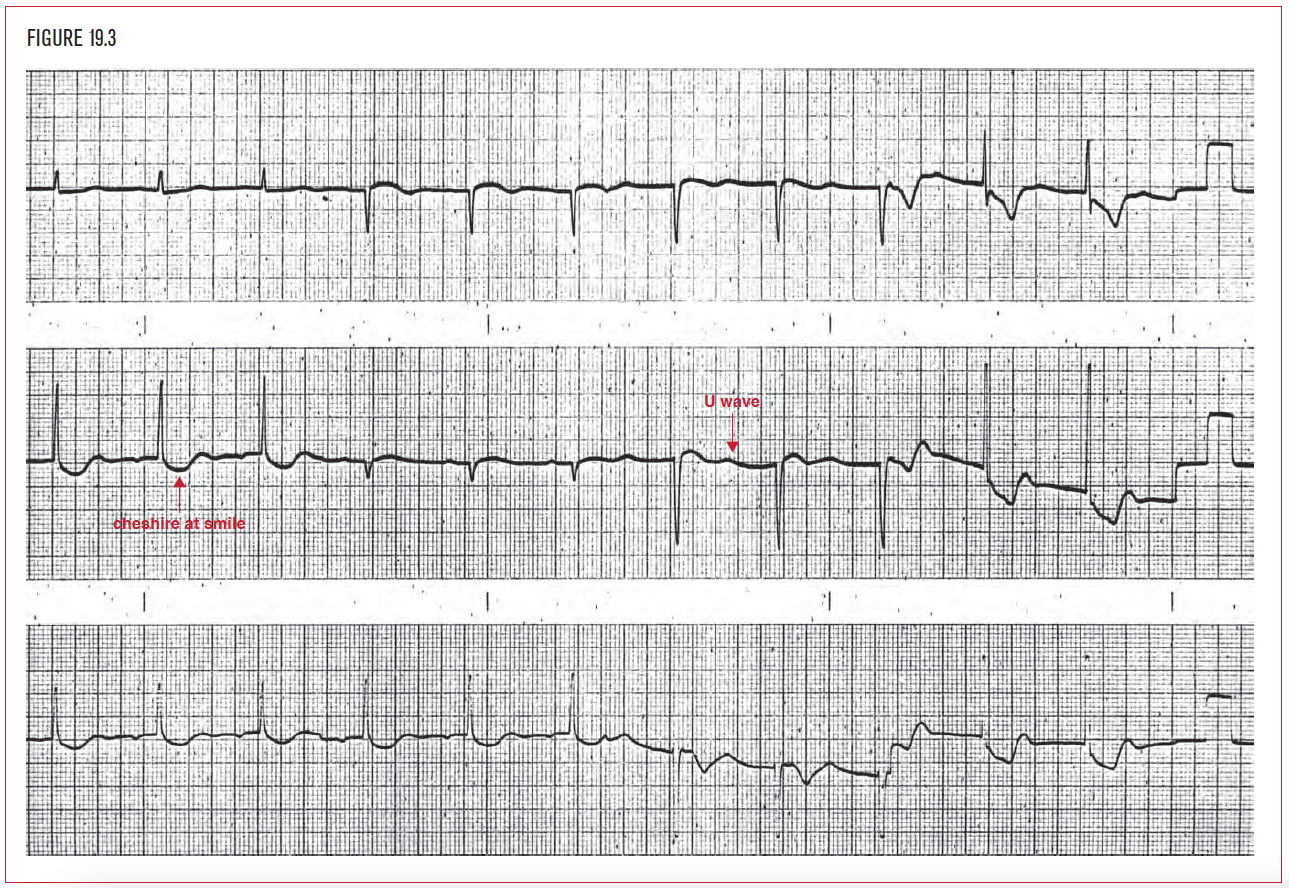
Figure 19.3 demonstrates junctional rhythm, a short QT interval, and diffuse “cheshire cat smile” ST depression in the inferior and lateral leads. The appearance of U waves in V2 represents coexisting hypokalemia, which exacerbates the digitalis effect.
Digitalis causes a short QT interval, but many drugs can be equally as dangerous by causing a long QTc interval. Common classes of these drugs are:
- Antiarrhythmics.
- Antibiotics.
- Antifungal agents.
- Anesthetics.
- Antivirals.
- Psychotropics.
- Chemotherapeutic agents.
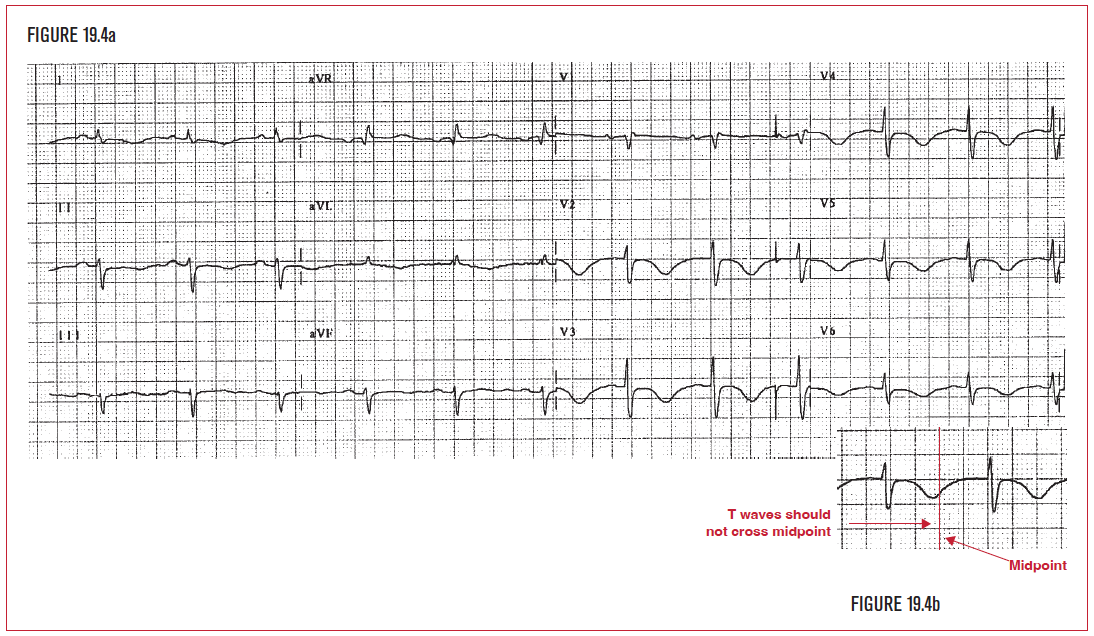
Figure 19.4a demonstrates a long QTc interval as a complication of Sotalol therapy, a Class III antiarrhythmic known to prolong the QTc interval. Amiodarone is another commonly used Class III antiarrhythmic that can have the same effect. Figure 19.4b demonstrates a visual reminder to help the reader double check the QTc. The normal T wave does not cross the midpoint between two QRS complexes.
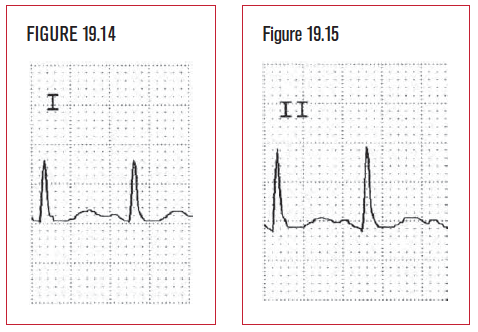
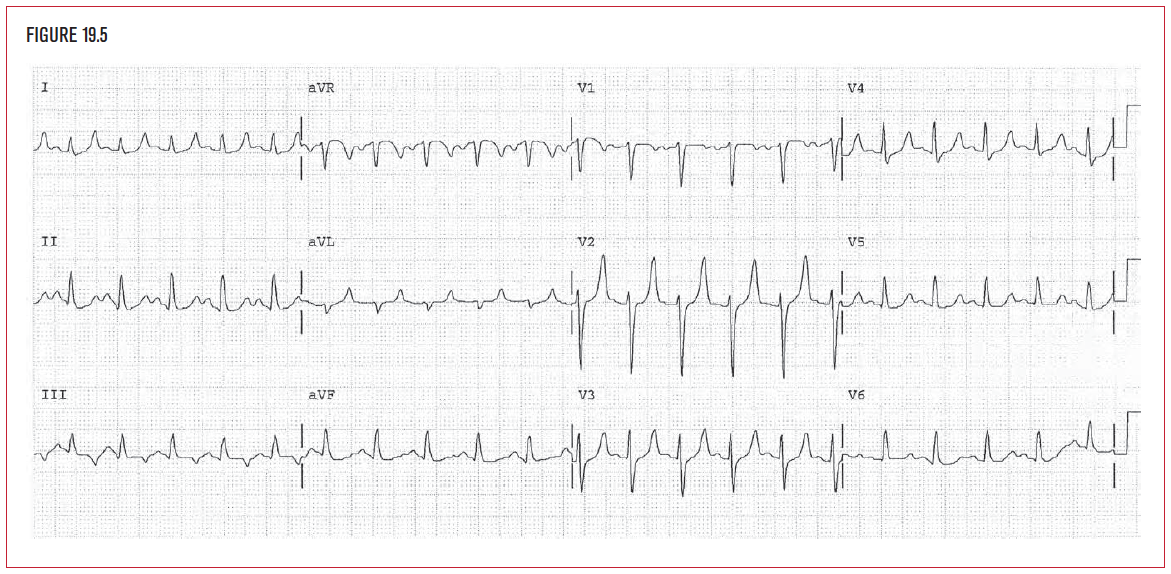
The normal electrical activity of the heart is dependent on the proper balance of specific serum electrolytes. Abnormal potassium (K+) levels have a direct effect on the normal electrical activity of the heart and of the myocardium. High serum potassium levels (hyperkalemia) depress conduction and impulse formation throughout the entire myocardium. This can initially produce peaked T waves on the EKG (Figure 19.5).
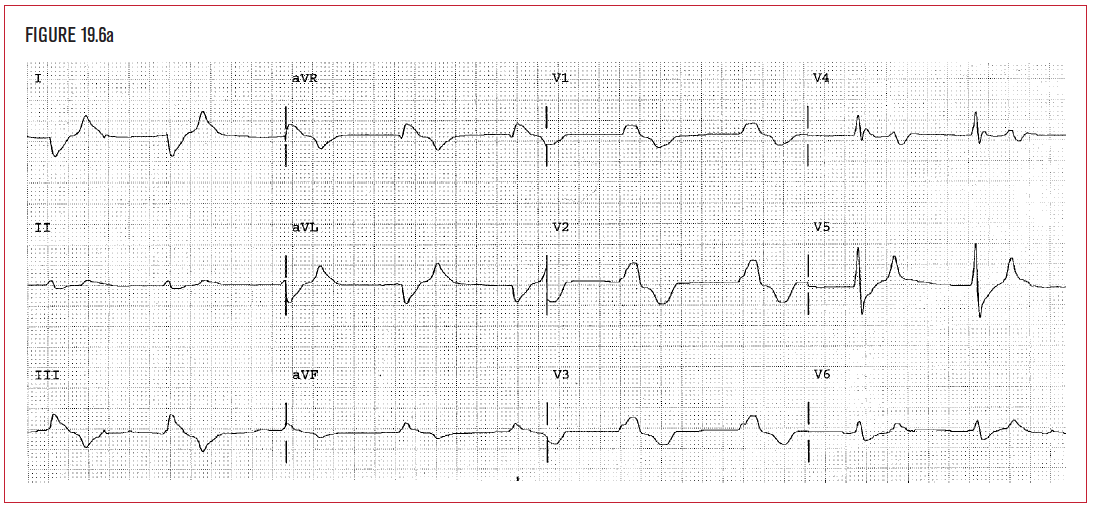
Higher serum potassium levels, or hyperkalemia, depress conduction and impulse formation throughout the entire myocardium. This can result in drastic changes in the EKG. If the potassium level rise continues even higher or increases more acutely, a wide and bizarre looking sine wave-like pattern appears, as shown in Figure 19.6a. (The patient’s potassium level was 8.8 mEq/L when this was taken.) Hyperkalemia is bizarrely wide (here 0.2 seconds) and doesn’t have the same appearance as bundle branch block, which is usually 0.12 to 0.16 seconds wide. Furthermore, the rate is less than 100, so this is not ventricular tachycardia. If not immediately recognized and reversed, hyperkalemia eventually depresses the conduction system to the point of asystole and death. The standard emergency therapeutic regimen is the administration of glucose and insulin intravenously, which temporarily drives the potassium into the cells and out of the blood. Removal of the excess potassium from the body is done through the gastrointestinal tract with an exchange resin (kayexalate), through the renal system with a diuretic, or by dialysis. A reader must immediately recognize and act on this EKG!
A low serum potassium level, or hypokalemia, increases irritability of the conduction system and myocardium, thereby increasing the likelihood and frequency of ventricular ectopy. The increased irritability of the myocardium generates:
- Ventricular ectopic beats.
- PVCs.
- Bigeminy.
- Paired PVCs.
- Ventricular tachycardia.
- Ventricular fibrillation.
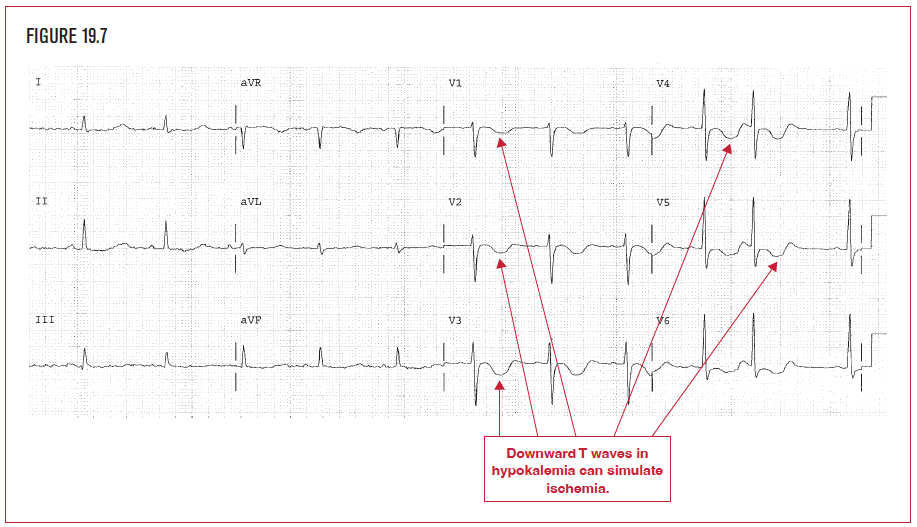
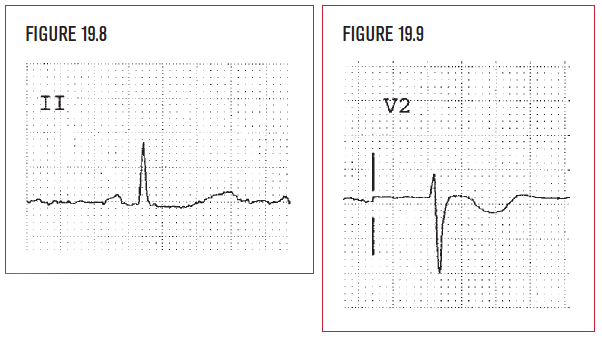
Hypokalemia produces flattened T waves. The QT interval becomes prolonged. A low amplitude T wave due to hypokalemia is a common reason why the QT interval may be difficult to measure with confidence. There can be diffuse ST segment depression, which looks like diffuse subendocardial ischemia (Figures 19.7–19.9). U waves (positive waves seen after the ST segment returns to baseline in the V leads) can sometimes be seen as well on the EKG. It is always clinically correct to worry about ischemia when ST depression or T wave inversion is present. It is essential to check the possibility of hypokalemia as well. The potassium level below was 1.7.
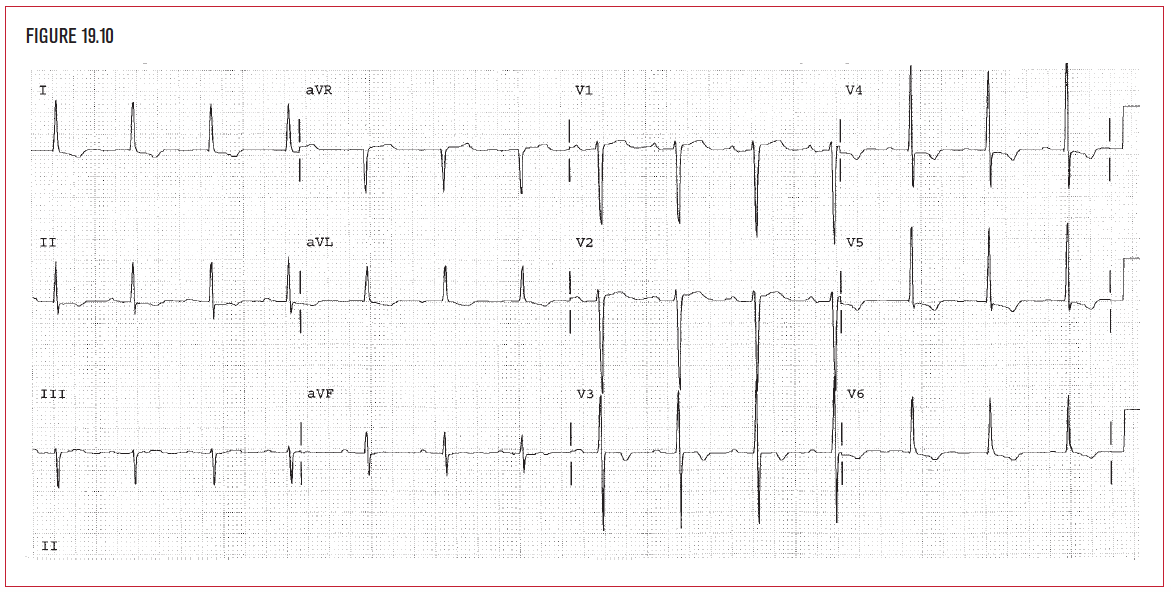
A high serum calcium level (hypercalcemia) produces shortened QT intervals on the EKG. Hypercalcemia occurs in primary hyperparathyroidism. It can also occur as a complication of metastatic cancer that has spread to bone. The mnemonic Pb-Ktl (lead kettle) for prostate, breast, kidney, thyroid, and lung cancer, should raise the clinical possibility of bone metastases and possible hypercalcemia. The QT interval here (Figure 19.10) is 0.30 seconds. The QTc is 0.353 seconds. The serum calcium level was 12.8 in this patient. Even higher calcium levels can depress conduction and cause heart block.
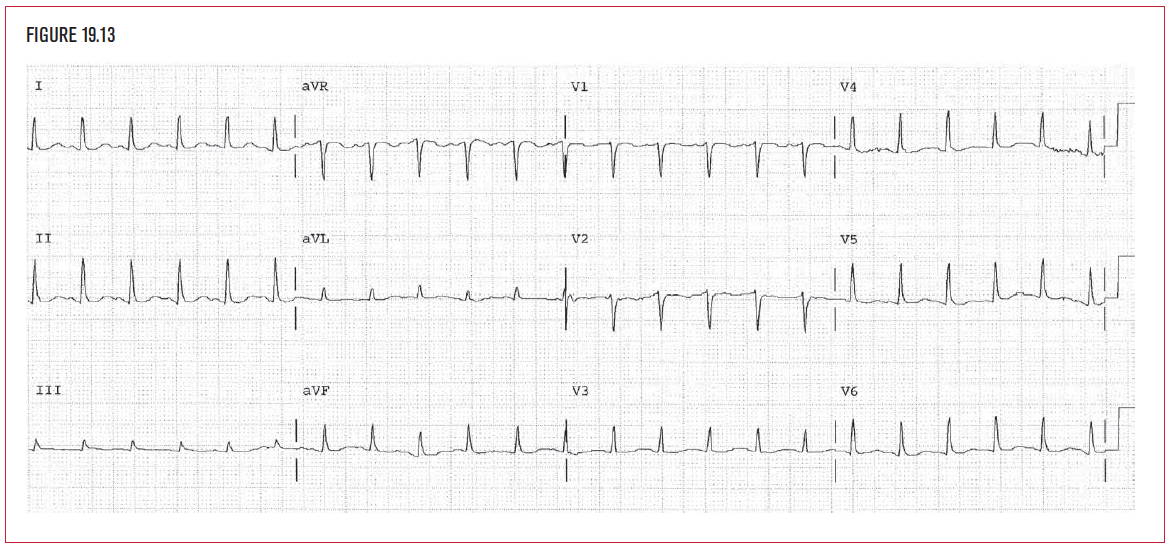
Low serum calcium levels, or hypocalcemia, produce a prolonged QT interval (Figures 19.13–19.15). As with all causes of long QTc, ventricular tachycardia (torsade), or ventricular fibrillation can result. Clinically this can be seen in hypoparathyroidism and transfusion-related hypocalemia. Massive transfusion of packed red blood cells can cause hypocalcemia. Packed cells are poor in ionized calcium and contain a calcium binding agent to prevent clotting of the cells. The anticlotting agent in packed red cells binds to calcium. In Figure 19.13, the serum calcium level was 6.1. The QT measures 0.34 seconds, the QTc is 0.491.