6. Axis: The science of direction

Headshot of Chris Anderson, MD · Clinical Education Director, Pediatrics
Chris Anderson
MD · Clinical Education Director, Pediatrics
envelope icon
Headshot of Kevin Hodges, Vice Chair, Emergency Medicine
Kevin Hodges
Vice Chair, Emergency Medicine
envelope icon phone icon
Table of Contents
  • Identify and describe the six frontal plane leads.
  • Identify and describe the six horizontal plane leads.
  • Locate leads I, II, III, AVL, AVR, and AVF on the frontal plane diagram.
  • Locate leads V1, V2, V3, V4, V5, and V6 on the horizontal plane diagram.
  • Memorize the three leads that define:
    • Rightward or leftward.
    • Up or down.
    • Anterior or posterior.
  • Distinguish whether a P wave, QRS complex, or T wave is pointing:
    • Rightward or leftward.
    • Up or down.
    • Anterior or posterior.
  • Describe the normal P wave direction.
  • Describe the significance of the P wave direction in determining whether the EKG was taken correctly or the arm leads were mistakenly reversed.
  • Identify and describe dextrocardia, junctional rhythm, and normal P wave directions.

The heart is a continuously active muscle that pumps blood. Think about that the next time you get on a treadmill, and the next time you think about eating a bacon cheddar cheeseburger. It must also produce electrical and mechanical energy on a continuous basis. Both forms of energy come from specialized cardiac muscle fibers. These fibers provide electrical signals and mechanical energy that physically pumps the blood. Although the EKG does not show that mechanical energy, it can be used to measure a variety of electrical events. Each of these occurs in a normal sequence, in a normal direction, and with a normal magnitude.


If we could see this electrical force with our eyes, it could look something like this. The atrial systole (Figure 6.1) would show a small force in the direction of the normal depolarization wave, down and to the patient’s left. The ventricular systole (Figure 6.2) would show a similar but much larger force in the same direction. Finally, the ventricles would reset or repolarize (Figure 6.3) with a force and direction that proceeds down and to the patient’s left.

Begin simply: If only we could see electricity

Of course, we cannot see electricity inside the body with our eyes, but other sensors, called electrocardiographic leads, can see electricity. An EKG has 12 leads, with 6 in the frontal plane, or view, and 6 in the horizontal, or top down, view. Because these sensors are so primitive, they can sense in one dimension only. Therefore, it is necessary to combine the partial information from each lead with the information from the other leads on the EKG for a complete three-dimensional picture of the electrical forces to emerge. By learning how to combine the “visual” information provided by each of the 12 primitive leads, we can actually reconstruct the direction and force that our eyes would see if we could see electrical events! This EKG in Figure 6.4 has 12 leads or sensors, each of which measures electricity from a different angle or viewpoint. We need to examine all 12 leads above to “see” the electrical force as in Figure 6.5! If you learn to calculate direction, you will be able to “see” the EKG (Figure 6.4) as it looks in Figure 6.5.

The 12 separate EKG leads equal one arrow visually

When a force is abnormal in size or direction, it may indicate that the specific part of the heart producing the force is abnormal. Therefore, learning the normal electrical direction of forces in the heart provides a simple and scientific way of understanding and interpreting an EKG. We will learn to measure the electrical direction for the P wave, the QRS complex, and the T wave, as well as for other forces throughout the book. The remainder of this chapter teaches one method for determining the direction of the electrical force for any of these waves, or complexes, on the EKG. By drawing out the electrical forces on paper, we can “see” the electrical force and learn simple concepts to help determine what is normal and what is abnormal. These 12 leads (as in Figure 6.6) usually each have a P wave, a QRS, and a T wave. Taken together, they allow us to “see” the actual electrical forces as though they were externally visible to our eyes. Learn to put the 12 leads into one picture. That is the secret of understanding an EKG!

memorize this

Begin to visualize: Draw the direction diagram.

When measuring the axis or direction of any force in the frontal plane, begin by drawing and labeling the leads as shown in this representation of a frontal view of the heart. Continue the line segments through the center to the other side of the circle. This results in the second diagram. We now have the six frontal plane sensors arranged in a circle. They will allow us to calculate and then visualize direction as up or down and right or left, within 15 degrees.

Add degrees to the frontal plane direction diagram.

To provide an easy and understandable way to describe direction, label each of the leads in degrees. Lead I is the starting point at 0°. Continuing counterclockwise is considered negative, but rotation clockwise from zero is considered positive. By combining the information from each of these leads (I, II, III, AVR, AVL, and AVF), the direction of any electrical force can be converted to a visual image. To clarify what the diagram represents, try imagining the heart superimposed on top of it. This is actually a way of clearly visualizing the direction of the force moving through the heart.

Diagram leads as one-dimensional sensors or observers

Place lead I on our diagram. This primitive sensor sees only in one dimension and looks at the view from the patient’s left side. It can “sense” whether or not an electrical force is present, tell us if that force is large or small, and also give us a single piece of information on direction. That is, whether the electrical force is going to the patient’s left or right side. Each diagram lead senses the patient’s P wave, QRS, and T wave. In this example (Figure 6.14), the P wave is upward in lead I. Therefore the atrial force is pointing toward the sensor, and to the patient’s left side. The QRS and T wave are normally pointing the same way as the P wave—in this example, to the patient’s left. Because this P wave in lead I is mostly upward or positive, we can “see” the P wave as pointing toward the patient’s left side. Mathematically, it would be somewhere between −90° and +90°. Visually, we can “see” the P wave as pointing to the patient’s left! And, since the QRS and T wave are both positive, we can visualize them as pointing to the patient’s left as well.

The frontal plane leads

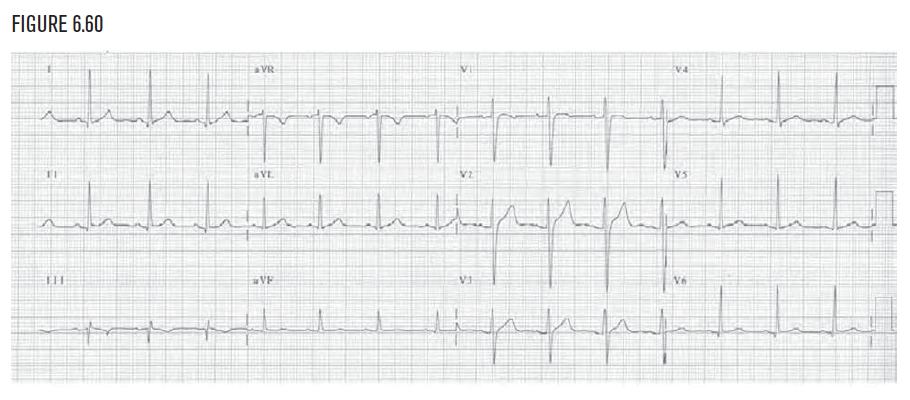
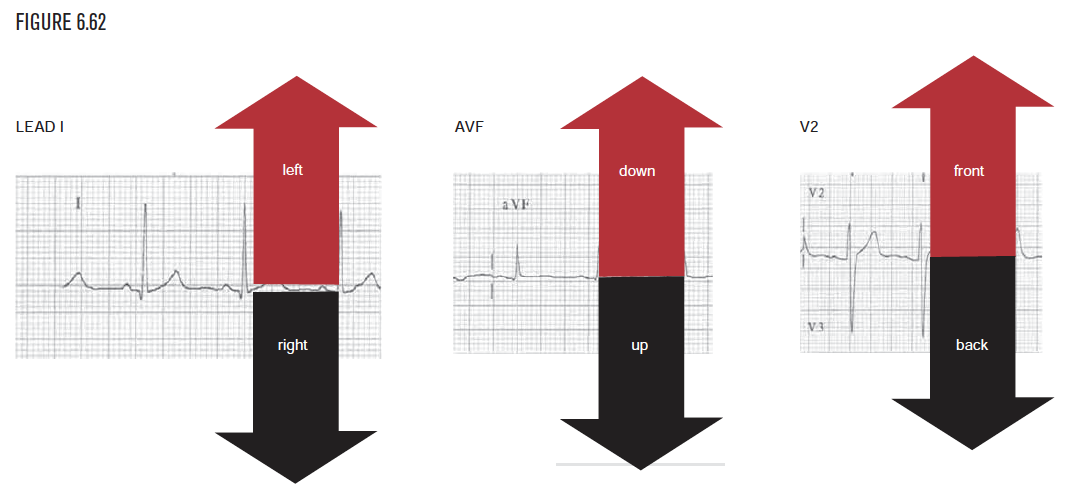
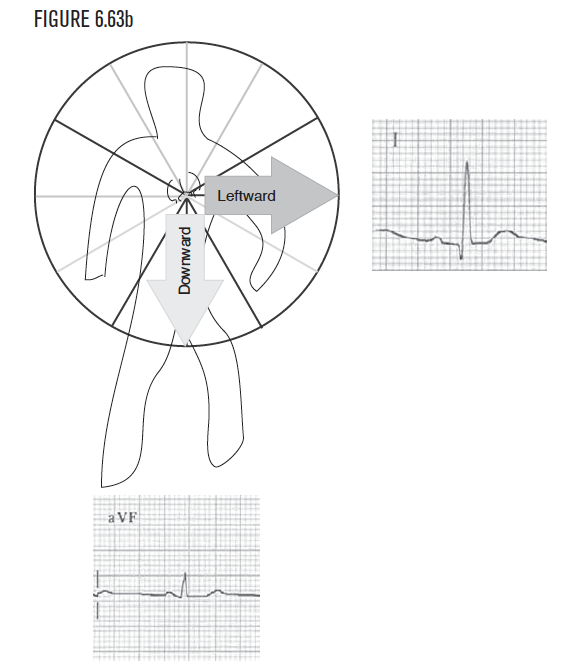
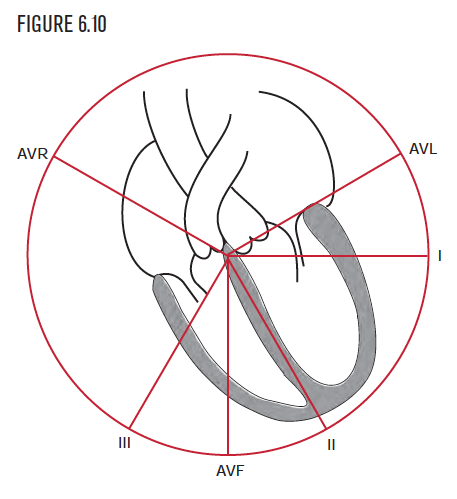
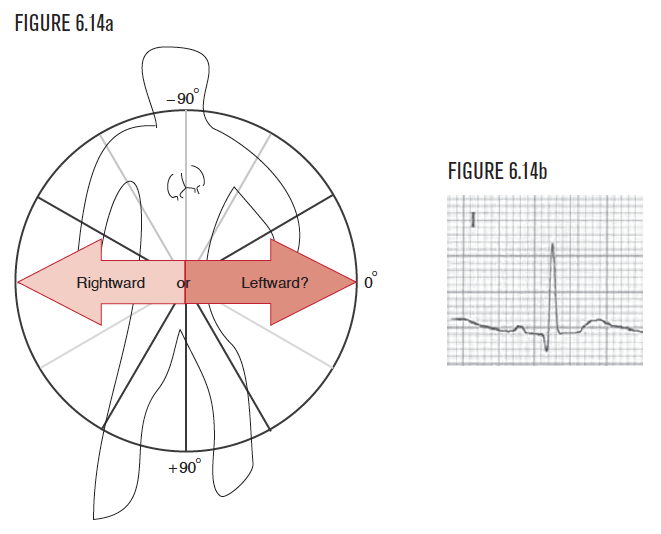
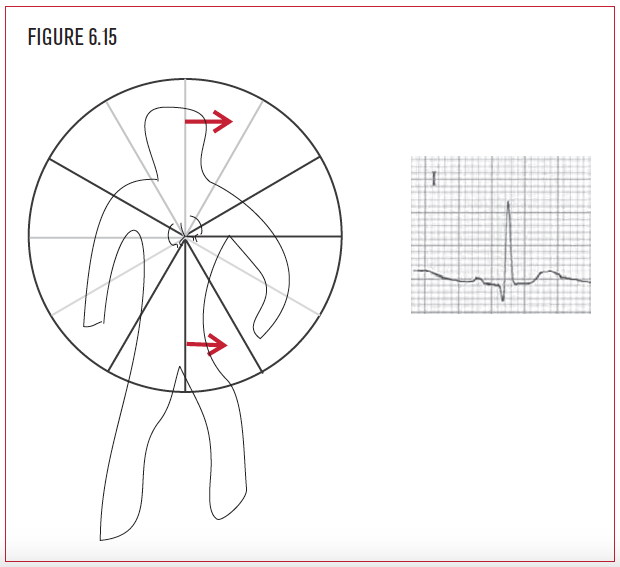
Remember that each lead is so primitive that it can “see” in only one dimension and can sense only if the electrical force is coming toward it or going away from it. Using this method, examine the P wave in lead I first. Your perspective is that of someone viewing the cardiac events from this location. The sensor at lead I is perfectly placed to provide one critical piece of information, namely whether the electrical force is pointing left or right. If the P wave (or any wave for that matter) is upright or positive, then the observer visualizes that force as pointing toward the patient’s left side. If the lead I sensor is negative or downward, the observer visualizes the force as pointing toward the patient’s right side. This concept of “positive = toward” and “negative = away” relative to any of the EKG leads is fundamental to visualizing direction.

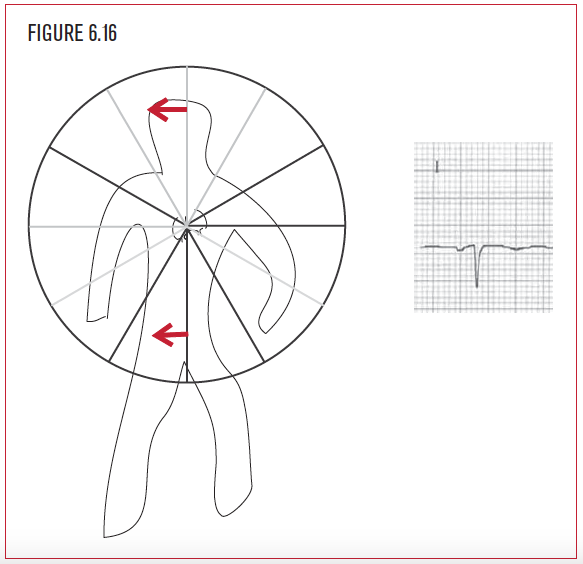
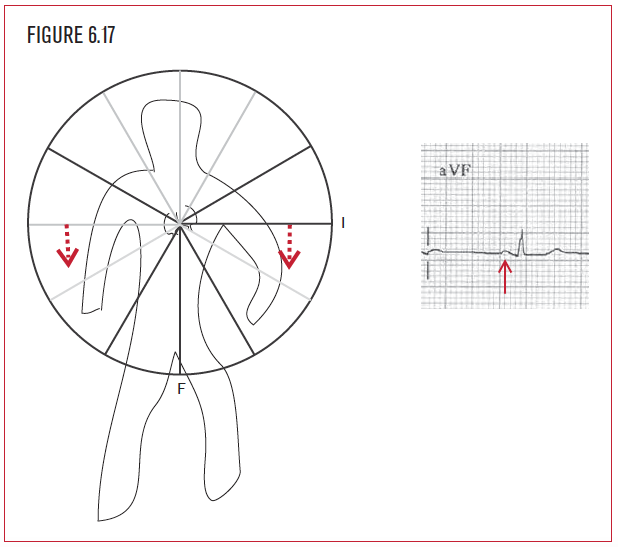
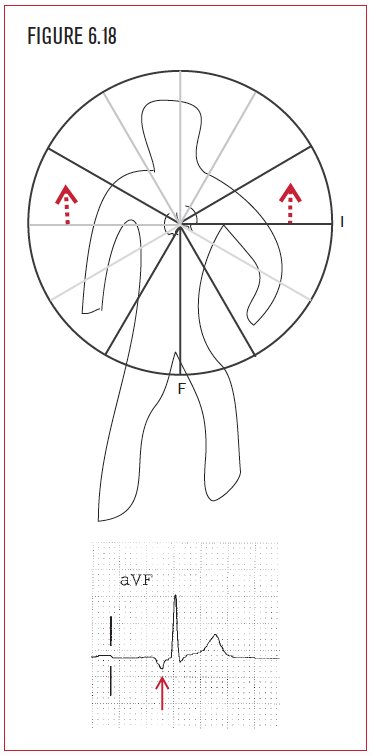
Once again, remember that each of the 12 EKG leads is so primitive it can “see” only in one dimension and can sense only if an electrical force is coming toward it or going away from it. Lead I has already let the observer visualize whether the force is pointing right or left. Lead AVF is the sensor below the patient’s feet and provides the perspective of someone viewing the cardiac events from below. The sensor at lead AVF is perfectly placed to provide another critical piece of information, namely whether the electrical force is pointing up or down. If the P wave (or any wave for that matter) is upright or positive, then the observer visualizes that force as pointing toward the patient’s feet, which is where AVF is placed. If the lead AVF sensor is negative or downward, then the observer visualizes the force as pointing toward the patient’s head. Be careful with AVF! If lead AVF is up, then visualize the force as downward!

The view from the top: The horizontal plane

Space has three dimensions. So do all living things. So far, we visualized the heart in two dimensions:

  • Up and down
  • Left and right

The third dimension, the horizontal plane, looks at the body and the heart from above. It visualizes right and left, but instead of up and down, it shows if the electrical force is moving frontward (anterior) or backward (posterior).

Draw the horizontal plane diagram

Lead V2 is directly anterior. Lead V6 is at the patient’s left.

Labeling the degree increments

Lead V6 is arbitrarily considered to be 0°. Counterclockwise from V6 is negative. Clockwise from V6 is positive.

Next assess the horizontal leads

Begin with V6. Since the QRS is positive in V6, the direction is toward the patient’s left side. The QRS is negative in V2. Therefore we visualize the QRS as pointing toward the patient’s back, which is normal.

3D summary and conclusion—step by step

We have determined that:

Lead Which told us
Lead I is positive
the QRS direction is leftward
Lead AVF is positive
the QRS direction is downward or inferior
Lead III is negative
the QRS direction was <+30°
Lead V2 is negative
the QRS direction was posterior!

And all that information is equivalent to saying the QRS direction is at +15° in the frontal plane and pointing posteriorly in the horizontal plane! This QRS direction is normal. Practice these visualizations thoroughly, and you will find the rest of the book reduces to very simple concepts.

memorize this

The three key leads to visualization!

Any P, or QRS, or T wave that is . . .

Upward in But downward in
Lead I is pointing to the patient’s left side
Lead I is pointing to the patient’s right side
Lead AVF is pointing inferiorly (careful!)
Lead AVF is pointing superiorly (careful!)
Lead V2 is pointing anteriorly
Lead V2 is pointing posteriorly

The P wave direction

Normally inferiorly and to the left

Depolarization of the right atrium and left atrium causes an electrical force that appears on the EKG as a P wave. The P wave has a normal direction based on this normal physiology. The electrical impulse is expected to travel through the atria toward the AV node in a direction (Figure 6.63a) that is downward and to the left. Therefore, the P wave would typically be positive in lead I (leftward) and positive in lead AVF (inferior) as well.

Step by step to diagnosis