


The PR interval measures the duration of time from the very beginning of atrial activation to the very beginning of ventricular depolarization. The very beginning of atrial activation appears as the start of the P wave, which is where measurement of the PR interval should begin. The very beginning of ventricular activation appears as the start of the QRS, which is where the measurement of the PR interval should end. (A better name for this interval would have been the P-QRS interval!) Most of the time, the PR interval is a physiological, or intentional, delay in transmitting the activation through the AV node. 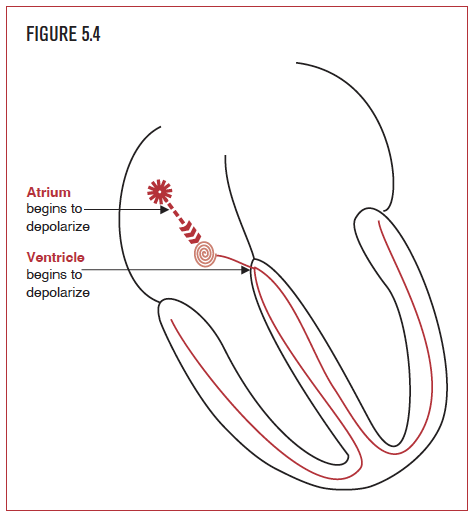 This delay is very important, because it allows the atria time to contract and pump blood into the ventricles before the ventricles begin to contract with the start of the QRS. Remember, the reason for these electrical events is to pump blood! Thus the atria contract, the AV node delays a bit so blood can flow into and fill the ventricles, and then the ventricles contract. Without the AV delay, the heart could not effectively pump in sequence. It would look like an assembly line gone wrong in an old I Love Lucy episode.
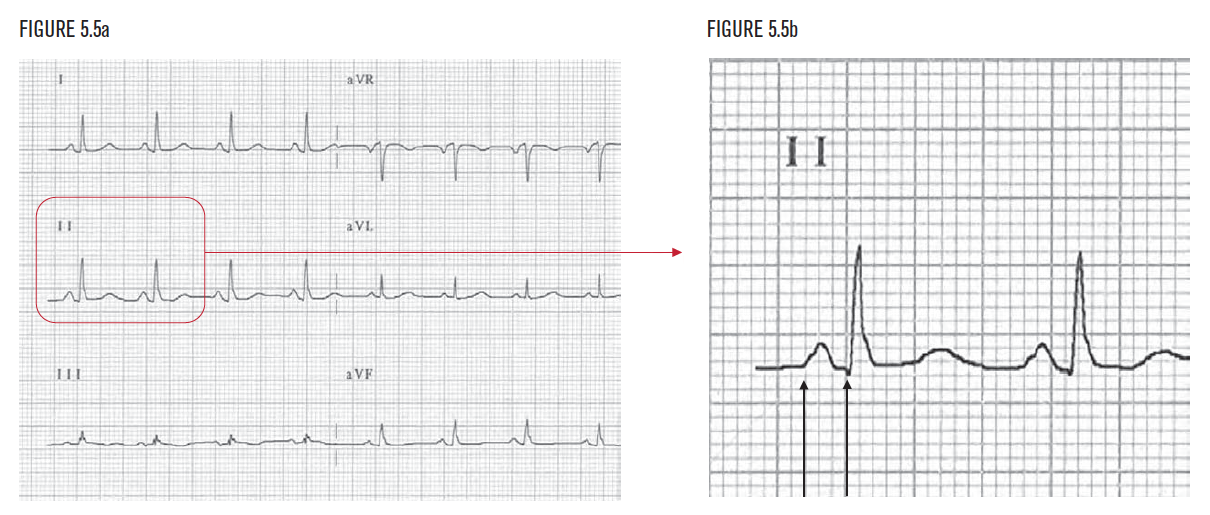
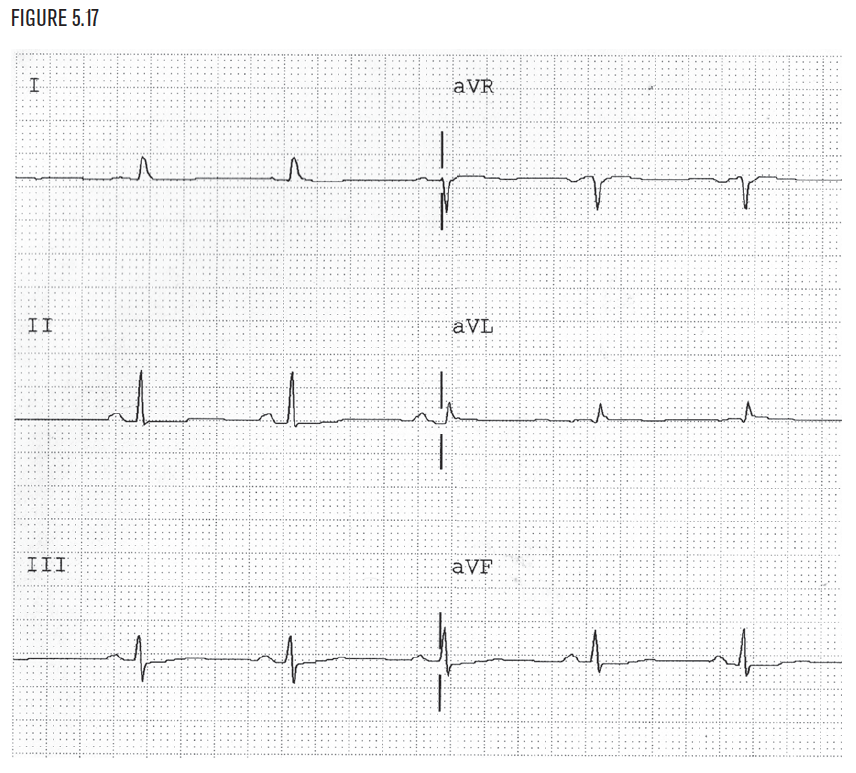
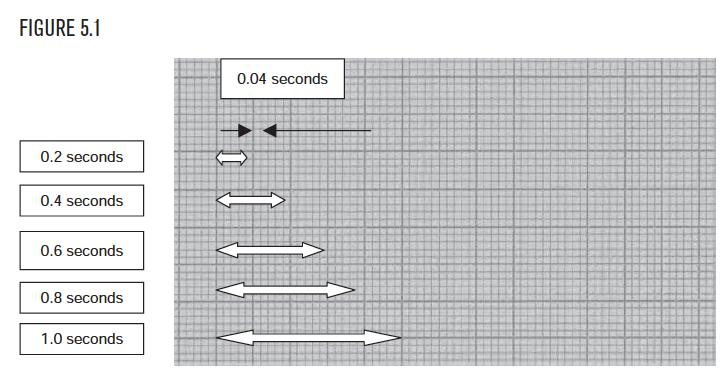
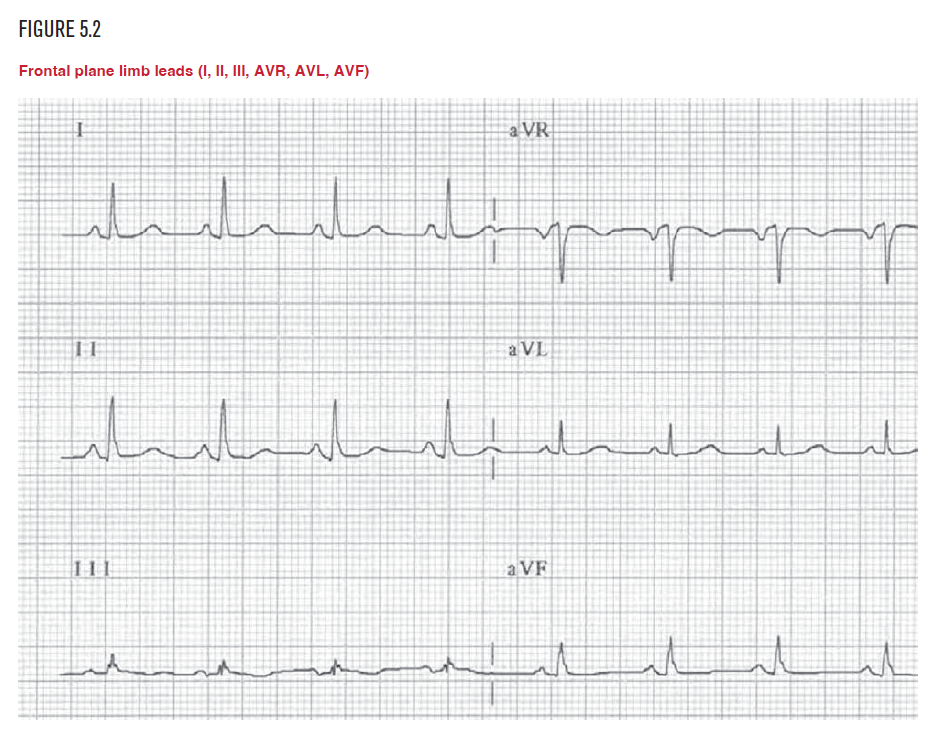
Diseases of the AV node can prolong conduction through the AV node to greater than 0.20 seconds. This is called first-degree AV block (10 AV block). Causes of 10 AV block include coronary artery disease, drug toxicity, infectious diseases such as Lyme disease, rheumatic fever, endocarditis, and degenerative diseases. AV block can be found in trained athletes, where an increased delay is necessary to allow more blood to enter the ventricle with every heart beat. As before, measure from the very beginning of the P wave to the very beginning of the QRS in the limb leads only, that is, leads I, II, III, AVR, AVL, or AVF. In this example, the PR interval is 9.0 boxes. Each little box represents 0.04 seconds. Thus, 9 boxes × 0.04 seconds for each box equals 0.36 seconds. Therefore, this PR interval (90 × 0.04) is 0.36 seconds long. The normal PR interval is 0.12 seconds to 0.2 seconds. This PR interval is longer than 0.20 seconds, so it is called 10 AV block.
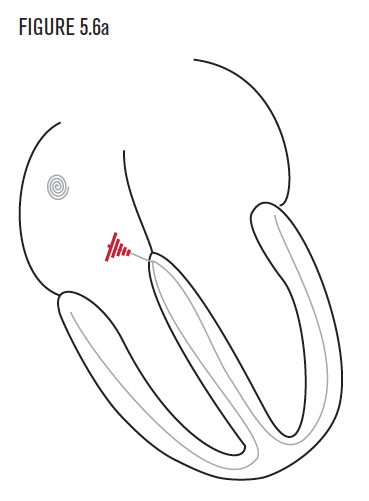
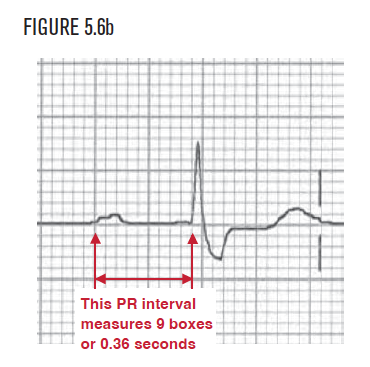
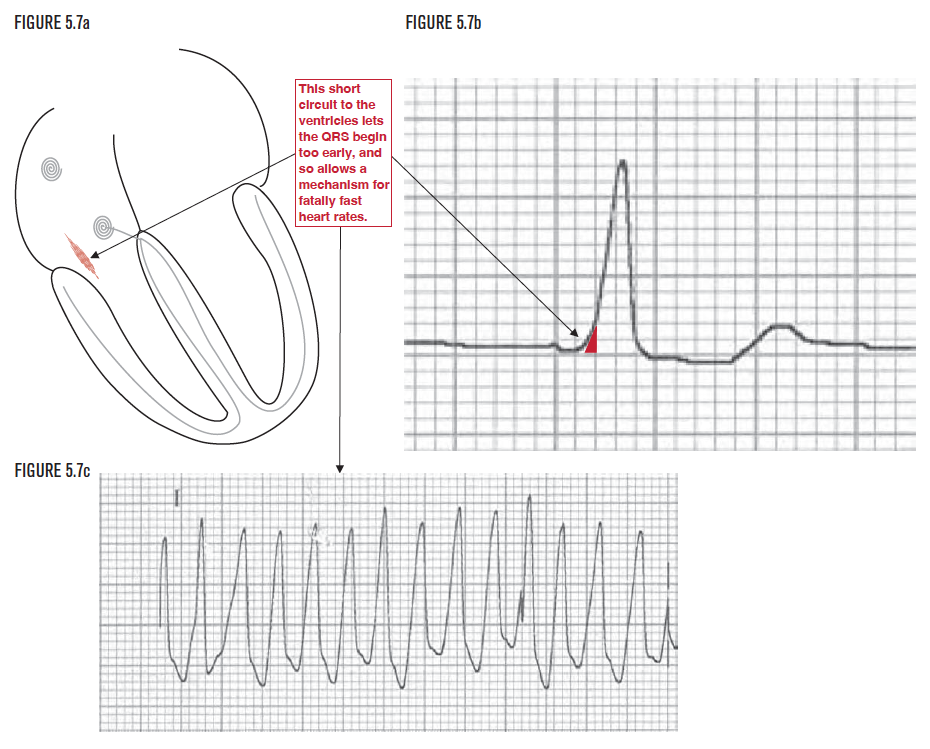
Figure 5.7a demonstrates an abnormal pathway that is present in some people. This pathway connects the atria to the ventricles, bypassing the normal AV node. As a result, the PR interval is shorter than 0.12 seconds. It is abnormally short because without the normal AV delay, some part of both ventricles start to depolarize too early. This produces an early depolarization of the ventricles, called a delta wave, as shown in Figure 5.7b. This short circuit is called an AV bypass tract, short PR syndrome, or WPW syndrome (named after Drs. Wolff, Parkinson, and White). It can be as dangerous as it sounds and can lead to fatally fast heart rates, as shown in Figure 5.7c. Careful inspection of this rhythm strip shows that successive R waves are as close as 4 little boxes apart. This calculates to a heart rate of 1500/4 or 375 bpm! The normal AV node has a built-in maximum allowable transmission rate to protect the ventricles. The only way to bypass this safety mechanism is with a genetic short circuit between the atria and ventricles. The ventricles simply cannot contract at this accelerated rate. (As an experiment, try to open and close the fingers of your hand into a fist at a rate of 5 or 6 times a second. That’s what the ventricles are trying to do at a rate of 300 to 360 bpm!) The ventricles cannot sustain a cardiac output at this rate, and the arrhythmia must be terminated.
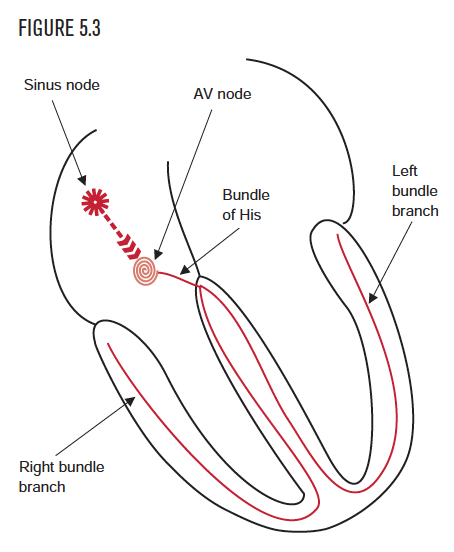
The next step after measuring and analyzing the PR interval is to evaluate the QRS interval. The QRS interval measures the time from the beginning of ventricular activation, which is the beginning of the QRS (whether it is a Q or an R wave!), and the end of ventricular activation, which is the end of the QRS. 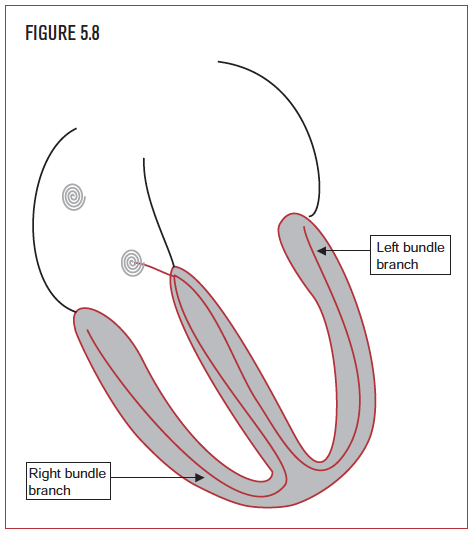 The QRS interval represents the amount of time it takes for the electrical impulse to depolarize the ventricles. The normal QRS interval is 0.09 seconds or less. This means that the hundreds of millions of cardiac cells that make up the ventricles are depolarized in less than 1/10 of a second. To accomplish this, a remarkable communication system relays the message from the AV node to two rapidly conducting firewires called the right bundle branch and the left bundle branch. To imagine how incredible this is, picture yourself standing in front of an auditorium filled with 1,000 people (not the millions of cells in the ventricles). Ask the crowd to stand at the snap of a finger. How long would it take for everyone to get the message and begin to stand? A few seconds? In the heart, millions of cells get the message, and ALL start to stand in less than a tenth of a second!
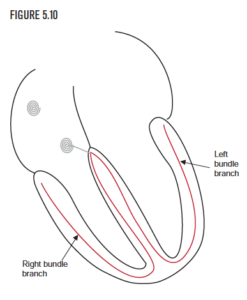
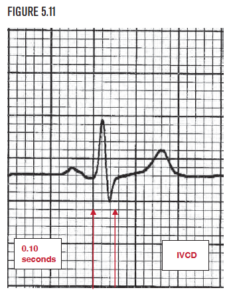
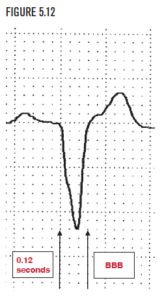
The normal right and left bundle branches are able to depolarize the normal right and left ventricle in less than 0.10 seconds, on average. A QRS interval of 0.10 seconds or more indicates a delay in conduction. The QRS interval in Figure 5.11 measures 2.5 little boxes, or 0.10 seconds long. A QRS interval of 0.10 second or greater (but less than 0.12 seconds) is given the awful name of IVCD for Intraventricular Conduction Delay. If the QRS interval reaches 0.12 seconds or longer, then bundle branch block is present. The QRS interval in Figure 5.12 is 3 little boxes wide, or 0.12 seconds long, indicating the presence of bundle branch block. Right and left bundle branch blocks will be fully discussed in Chapters 11 and Chapter 12.
A short QT interval occurs when the QTc is shorter than it should be for the heart rate. Short QT syndome can be inherited or acquired. The inherited form has been described only recently. It is associated with specific abnormalities of the cell membrane channels, the doors in the cell membrane that let the charged ions in and out. SQTS allows potassium ions (K+) to leave the cell (through the broken door) more freely during repolarization. The cell is ready to depolarize too soon, and this predisposes to atrial fibrillation, syncope, ventricular fibrillation, and sudden death. 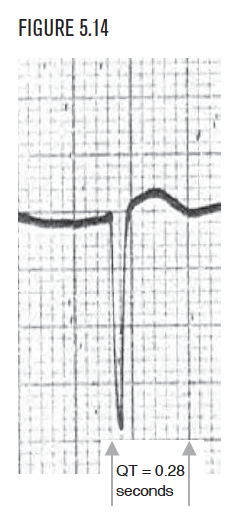 It can occur in young healthy people with no history of heart disease. With this syndrome, the QT does not appear to decrease with increasing heart rate, but appears very short in normal heart rates, usually approximately 0.30 seconds. Because the QT normally decreases with faster heart rates, it is better to recheck the QT at rates less than 100 beats per minute. If the measured QT (before correction) is less than 0.32 seconds, then remeasure it and calculate the QTc. In this syndrome, electrophysiologic testing (EPS) directly measures and confirms the decreased refractory periods (shorter repolarization times) for both the atria and ventricles. Some drug treatments and acquired diseases can also shorten the QT and QTc. These include treatment with digitalis and hypercalcemia.
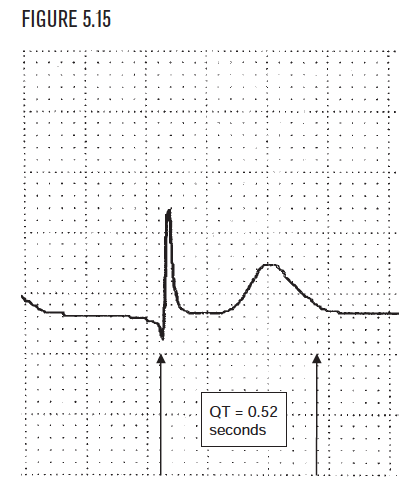
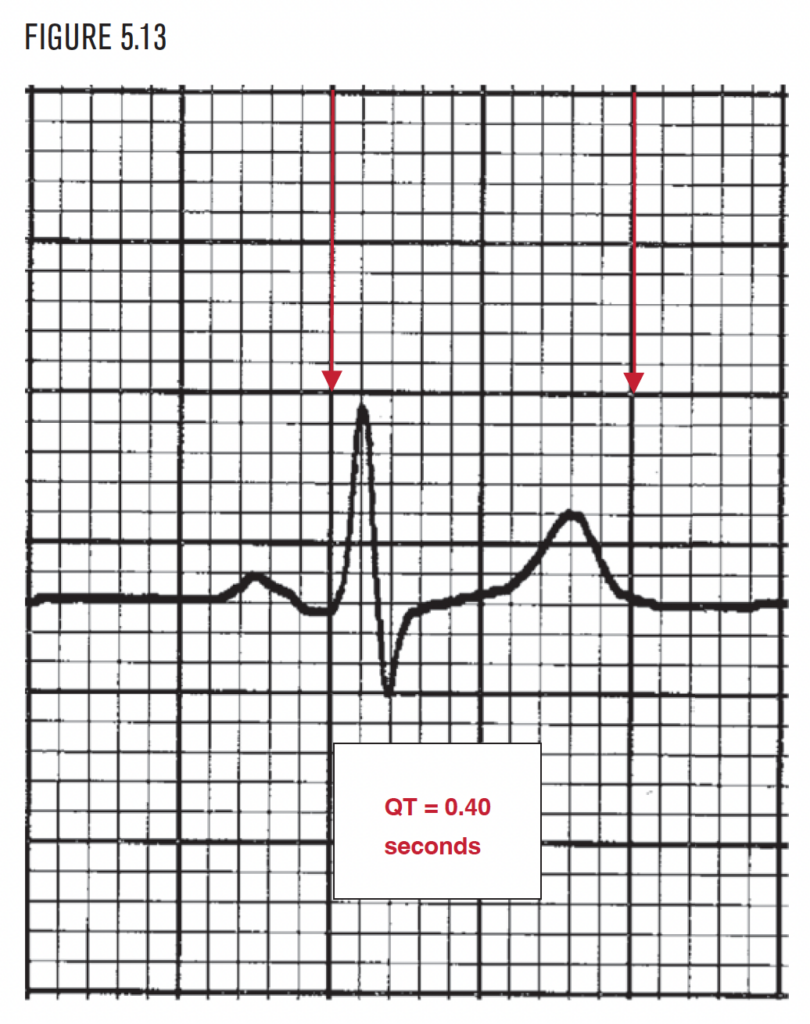
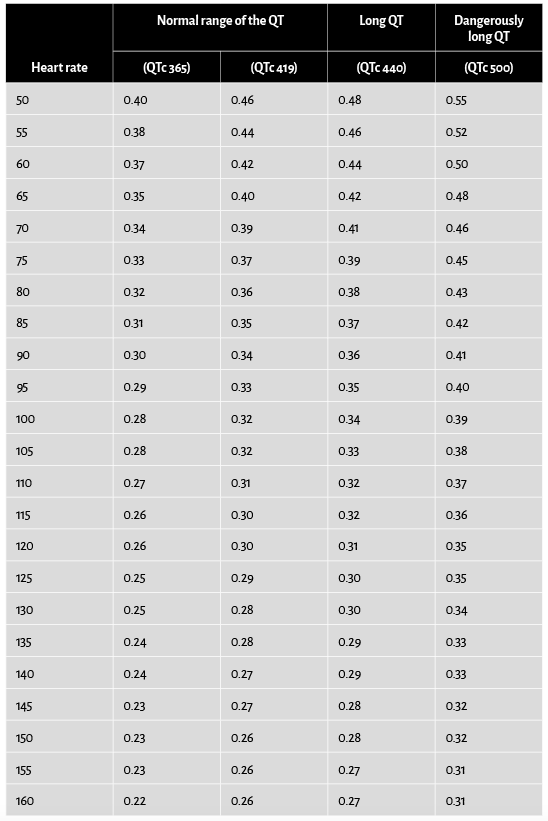
A long QT interval is present when the corrected QT interval (QTc) is greater than 0.44 seconds. The closer the QTc gets to 0.50 seconds, the more dangerous it becomes. Prolonged QTc is associated with sudden death because of malignant ventricular arrhythmias, particularly polymorphous ventricular tachycardia (torsade). Prolonged QTc can be inherited or acquired. The inherited form is termed long QT syndrome (LQTS). As with short QTc, the etiology is abnormal channels (channelopathies) on the cell membrane. These are the doors that let ions into and out of cells. In the case of long QTc, the abnormal channel function delays the cell’s repolarization. This appears on the EKG as a long QT interval. An uncorrected QT that measures 0.40 seconds or more is probably long. A QTc greater than 0.44 seconds may be at a dangerous level. Acquired long QT syndrome is typically caused by drug effects or abnormal electrolyte imbalance.